Perfect & Imperfectly Competitive Markets & Monopolies (AQA A Level Economics): Exam Questions

Exam code: 7136

4 hours21 questions
1
Sme Calculator
1 mark

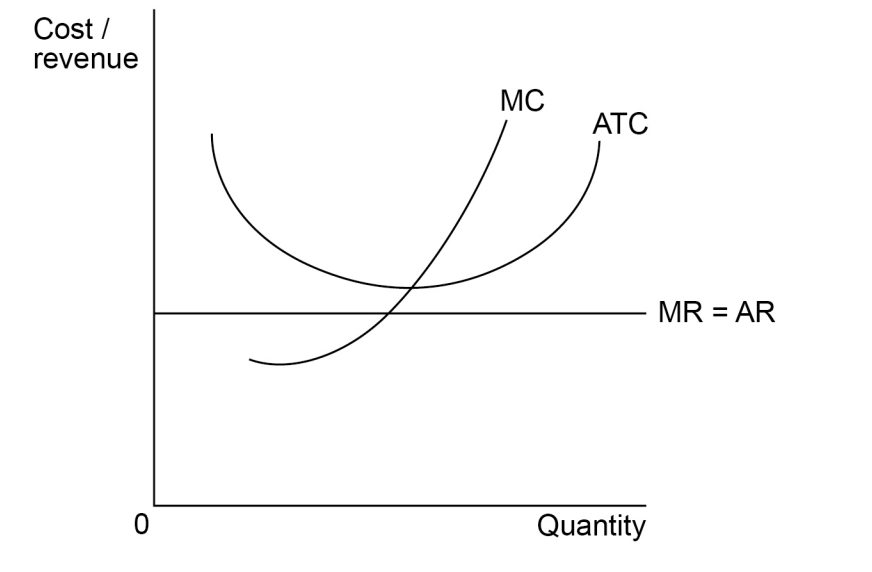
Figure 2 shows the equilibrium position, point E, of a profit-maximising firm in a monopolistically competitive industry.


q8-paper-3-june-2020-aqa-a-level-economics


All other things being equal, which one of the following applies to the firm’s equilibrium at point E? The firm is

  • in short-run equilibrium, but not in long-run equilibrium.

  • making normal profit because AC = AR.

  • making supernormal profit because MC = MR.

  • productively efficient but not allocatively efficient.

2
Sme Calculator
1 mark

A monopolistically competitive firm’s demand curve is 

  • also the market demand curve. 

  • inelastic throughout its length. 

  • the firm’s average revenue curve. 

  • the same as its marginal revenue curve. 

3
Sme Calculator
1 mark

The diagram below shows the kinked demand curve (D) for a firm operating in a competitive oligopolistic market.


q18-paper-3-june-2019-aqa-a-level-economics


The kinked demand curve model provides an explanation of why the 

  • firm colludes with competitors to set the price of 0P1. 

  • firm’s demand curve becomes more elastic as it lowers its price. 

  • firm’s price changes depend on competitors pricing behaviour.

  • firm won’t change its price from 0P1 even if competitors change their prices. 

4
Sme Calculator
1 mark

The diagram below shows the average revenue and marginal revenue (AR and MR) curves, and the average cost and marginal cost (AC and MC) curves, for the only firm in an industry.

q27-paper-3-june-2019-aqa-a-level-economics

If the market is highly contestable, in the long run, the firm is most likely to set its price at

  • 0P1

  • 0P2

  • 0P3

  • 0P4

5
Sme Calculator
1 mark

The diagram below shows a firm operating in perfect competition in the short run. 

q21-june-2018-aqa-a-level-economics

Which quantity, OE, OF, OG or OH, indicates the output where profits are maximised? 

  • OE

  • OF

  • OG

  • OH

6
Sme Calculator
1 mark

Which one of the following is most likely to measure the degree of competition in an oligopolistic industry?

  • The price elasticity of supply in the industry

  • The profitability of the 10 largest firms in the industry

  • The three firm concentration ratio

  • The value of the Gini coefficient

7
Sme Calculator
1 mark

The diagram below shows the cost and revenue curves for a monopoly.

q8-june-2017-aqa-a-level-economics


At which one of the following levels of output would the firm be productively efficient?              

  • OW

  • OX 

  • OY 

  • OZ