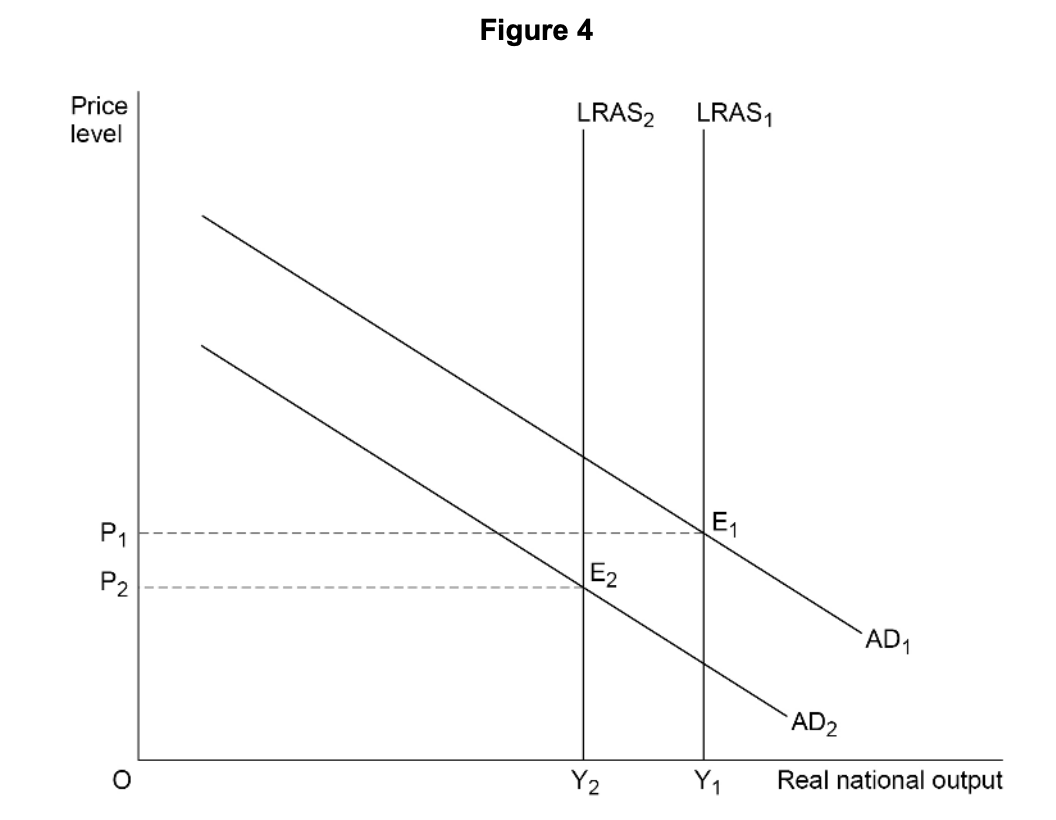
How the Macroeconomy Works (AQA A Level Economics): Exam Questions

Exam code: 7136

1 hour25 questions
11 mark

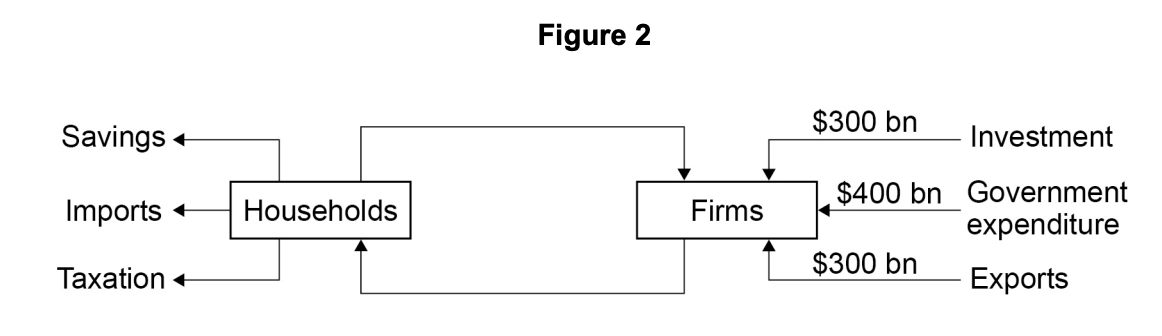
In an economy, the marginal propensity to consume is 0.6. All other things being equal, which one of the following statements is correct?

  • A £5 billion reduction in the economy’s national income will result in a £3 billion fall in consumption

  • If injections into the circular flow of income equal £20 billion, national income will equal £32 billion

  • If injections into the circular flow of income rise by £10 billion, national income will rise by £6 billion

  • When the economy’s national income equals £100 billion, consumption will equal £60 billion

21 mark

Figure 7 shows two aggregate demand (AD1 and AD2) curves and two long-run aggregate supply (LRAS1 and LRAS2) curves for an economy.

q26-paper-3-june-2020-aqa-a-level-economics

All other things being equal, which one of the following combinations, A, B, C or D, is most likely to explain the movement of the economy from E1 to E2? An increase in the

  • budget surplus and size of the multiplier.

  • exchange rate and supply of money.

  • rate of inflation and positive output gap.

  • volume of exports and potential output.

31 mark

The diagram below shows the aggregate demand (AD) curve, the long-run aggregate supply (LRAS) curve, and two short-run aggregate supply (SRAS1 and SRAS2) curves for an economy. The economy’s initial equilibrium is at E1.

q4-paper-3-june-2019-aqa-a-level-economics

The most likely explanation for the move of the economy from its initial equilibrium at E1 to a new short-run equilibrium at E2 is a decrease in the

  • level of tariffs on imports.

  • productivity of capital.

  • rate of wage inflation.

  • value of government subsidies to farmers.

41 mark

Which one of the following policies is most likely to improve the supply side of the economy? A policy which

  • increases the budget surplus

  • reduces the natural rate of unemployment

  • shifts resources from capital to labour intensive industries

  • shifts the burden of tax from indirect to direct taxation.

51 mark

The diagram below shows two aggregate demand (AD) curves and the short-run aggregate supply (SRAS) curve for an economy.

q12-june-2018-aqa-a-level-economics

All other things being equal, the change in real national output from Y1 to Y2 is most likely to have been caused by an increase in the

  • government’s budget deficit.

  • level of interest rates.

  • size of the labour force.

  • volume of exports.

61 mark

An economy is in a state of macroeconomic equilibrium. The levels of investment, savings, exports and imports are shown below.

Injections into and withdrawals from the circular flow of income

Investment                                     £200 bn

Savings                                              £200 bn

Exports                                              £300 bn

Imports                                              £400 bn

It can be inferred from the data in the table above that

  • government expenditure equals taxation.

  • the budget surplus equals the balance of payments surplus.

  • the budget surplus equals the balance of payments deficit.

  • the government has a budget surplus.

71 mark

The diagram below shows two long-run aggregate supply (LRAS) and two short-run aggregate supply (SRAS) curves for an economy.

q18-june-2018-aqa-a-level-economics

All other things being equal, which one of the following is most likely to explain the movement to the right of both the short-run and long-run aggregate supply curves?

  • A large increase in the availability of renewable energy within the economy

  • An increase in employment and a depreciation of the exchange rate

  • An increase in the natural rate of unemployment and the level of money wage rates

  • A supply-side shock to the economy which increases the rate of inflation

8
Sme Calculator
1 mark

Assuming that the value of the marginal propensity to consume is 0.6, which of the following changes in national income would result from an increase in exports of £19bn?

  • £31.7bn

  • £47.5bn

  • £76bn

  • £114bn

9
Sme Calculator
1 mark

The diagram below depicts an aggregate demand (AD) curve and two long-run aggregate supply (LRAS) curves for an economy. The economy’s initial equilibrium is at E1

q18-june-2017-aqa-a-level-economics

All other things being equal, the movement of the economy from its initial equilibrium at E1 to E2 is most likely to be caused by an increase in

  • government borrowing

  • labour productivity

  • the rate of deflation.

  • money wage rates

101 mark

The diagram below shows the aggregate demand (AD) and two short-run aggregate supply (SRAS) curves for an economy.

q28-june-2017-aqa-a-level-economics

All other things being equal, which one of the following is most likely to cause the short-run aggregate supply curve to shift from SRAS1 to SRAS2?

  • A fall in the size of the labour force

  • An increase in imports

  • An increase in the value of the multiplier

  • Lower world commodity prices

11
Sme Calculator
1 mark

Figure 1 shows three aggregate demand (AD) curves, a short-run aggregate supply (SRAS) curve and a long-run aggregate supply (LRAS) curve.

q4-paper-3-june-2020-aqa-a-level-economics

In Figure 1, when

  • aggregate demand shifts from AD1 to AD2, cyclical unemployment is likely to be eliminated.

  • aggregate demand shifts from AD1 to AD3, the rate of economic growth is equal to (Y3 – Y1).

  • the economy is producing at Y1, there is a positive output gap.

  • the economy is producing at Y1, there is a positive output gap.

121 mark

Figure 4 shows two aggregate demand (AD1 and AD2) curves and two long-run aggregate supply (LRAS1 and LRAS2) curves for an economy.

Economic graph depicting shifts in aggregate demand and long-run aggregate supply, showing equilibrium points E1 and E2 with price and output changes.

All other things being equal, which one of the following is the most likely explanation for the movement of the economy from E1 to E2?

  • A decline in the capital stock resulting from a significant decline in bank funding for business investment

  • An increase in net foreign investment by firms following a reduction in the rate of inflation

  • An unexpected reduction in the rate of interest following a fall in the rate of inflation

131 mark

Figure 10 shows two aggregate demand (AD1 and AD2) curves and two short-run aggregate supply (SRAS1 and SRAS2) curves for an economy

Graph depicting shifts in short-run aggregate supply (SRAS) and aggregate demand (AD) curves, showing equilibrium points E1 and E2 with price levels P1 and P2.

All other things being equal, which one of the following is the most likely explanation for the movement of the economy from E1 to E2?

  • A depreciation of the currency and an increase in interest rates

  • A fall in the prices of raw materials and an increase in investment

  • An increase in exports and the rate of Value Added Tax

  • An increase in the supply of money and the level of money wages

141 mark

Figure 2 shows the injections into and withdrawals from the circular flow of income of an economy which is in macroeconomic equilibrium

Flowchart showing economic flows: Households to savings, imports, taxation, and Firms. Firms to investment, government expenditure, exports, each $300-400bn.

In the economy, net exports are –$50bn. Which one of the combinations, A, B, C or D, shows the levels of savings, taxation and imports?

Savings ($bn)

Taxation ($bn)

Imports ($bn)

A

300

350

350

B

350

400

250

C

350

250

350

D

450

300

250

    151 mark

    A £2 billion rise in government spending has led to an increase of £5 billion in national income.

    All other things being equal, what is the value of the marginal propensity to consume?

    • 0.4

    • 0.6

    • 2.5

    • 3.0

    161 mark

    According to the accelerator process, a slowdown in the rate of growth of national income will lead to a fall in the

    • level of investment

    • marginal propensity to save.

    • rate of interest.

    • value of the multiplier.

    171 mark

    Table 4 shows the values of nominal GDP and a price index in two different years.

    Table 4

    Year

    2015

    2019

    Nominal GDP (£ billions)

    250

    290

    Price index

    100

    110

    What was the value of real GDP in 2019, to the nearest £ billion, expressed in 2015 prices?

    • £227 billion

    • £261 billion

    • £264 billion

    • £319 billion

    181 mark

    Which one of the following is an injection into the circular flow of income?

    • Factor incomes

    • Government borrowing

    • Investment

    • Savings

    191 mark

    Figure 7 shows two long-run aggregate supply curves (LRAS) for an economy

    Graph titled "Figure 7" showing two vertical lines, LRAS1 and LRAS2, indicating long-run aggregate supply shifts, with price level and real national output axes.

    Which one of the following is most likely to explain the shift of the long-run aggregate supply curve from LRAS1 to LRAS2?

    • A reduction in the basic and higher rates of income tax

    • A reduction in the geographical mobility of labour

    • An increase in immigration

    • An increase in imports of goods and services