Fiscal & Supply-side Policies (AQA A Level Economics): Exam Questions

Exam code: 7136

3 hours33 questions
1
Sme Calculator
1 mark

All other things being equal, which one of the following is most likely to increase the national debt?

  • Foreign companies increasing their direct investment into the economy

  • The central bank using its reserves of foreign currency to fund a trade deficit

  • The government reducing its budget surplus by increasing its expenditure on infrastructure

  • The government running a budget deficit, financed by selling bonds to foreign investors

2
Sme Calculator
1 mark

Which one of the following is correct for a proportional tax on income?

  • The amount of tax paid increases as income increases.

  • The marginal rate of tax is lower than the average rate

  • The average rate of tax falls as income increases

  • The average rate of tax is lower than the marginal rate

3
Sme Calculator
1 mark

The diagram below shows the aggregate demand (AD) curve, the short-run aggregate supply (SRAS) curve and the long-run aggregate supply (LRAS) curve for an economy. The economy’s initial equilibrium is at E1.

q10-paper-3-june-2019-aqa-a-level-economics

The government wants to achieve economic growth without conflicting with its long-run objective of price stability. All other things being equal, which one of the following policy combinations is most likely to enable the economy to achieve a new long-run equilibrium at E2?

  • A reduction in interest rates and increased government borrowing.

  • A reduction in the budget deficit and the rate of growth of the money supply.

  • Increased government expenditure on apprenticeships and transport infrastructure funded through borrowing.

  • Increased government expenditure on welfare funded through higher indirect taxes.

4
Sme Calculator
1 mark

The table below shows different combinations of changes in the rate of interest and the government’s budget position. The economy has a negative output gap. All other things being equal, which one of the combinations of policies, A, B, C or D, is most likely to reduce the economy’s negative output gap? 


Rate of interest

Government’s budget position

A

Increase

Decrease in surplus

B

Decrease

Increase in surplus

C

Increase

Decrease in deficit

D

Decrease

Increase in deficit

    5
    Sme Calculator
    1 mark

    The marginal propensity to consume (MPC) in an economy is 0.5. If the MPC increases by 20% the new value of its multiplier will be

    • 2.0

    • 2.5

    • 5.0

    • 10.0

    6
    Sme Calculator
    1 mark

    At the start of the financial year, an economy’s national debt stands at £1000 billion. Over the course of the year, the government plans to spend an extra £100 billion and borrow an extra £40 billion.

    If the government achieves its spending and borrowing targets, by the end of the financial year the national debt will have increased by

    • 4%

    • 10%

    • 14%

    • 40%

    7
    Sme Calculator
    1 mark

    All other things being equal, an increase in the ratio of capital to labour resulting from an increase in investment is most likely to lead to a

    • decline in labour productivity

    • fall in the size of the labour force

    • negative demand-side shock to the economy

    • supply-side improvement

    8
    Sme Calculator
    1 mark

    Which one of the following is most likely to cause an increase in the structural budget deficit?

    • A fall in income tax receipts in the downturn of the economic cycle

    • A rise in government spending on unemployment-related benefits during a recession

    • A rise in healthcare expenditure and state pension provision due to an ageing population

    • A rise in spending on imports during an economic recovery

    9
    Sme Calculator
    1 mark

    The table below shows the marginal income tax rates in an economy for 2016.

    Table: Marginal income tax rates for every $1 of income

    Taxable Income

    Income tax rates 2016

    From $0 to $10 000

    0%

    From $10 001 to $30 000

    10%

    From $30 001 to $50 000

    30%

    $50 001 and above

    45%

    How much income tax would be payable by someone earning $40 000 in 2016?

    • $5 000

    • $5 500

    • $10 000

    • $12 000

    10
    Sme Calculator
    1 mark

    The national debt is the

    • annual budget deficit plus the external trade deficit

    • amount by which the budget deficit increases each year

    • annual difference between government spending and tax receipts

    • the cumulative stock of outstanding central government borrowing

    111 mark

    Which one of the following statements regarding supply-side policies is correct?

    Supply-side policies

    • can have microeconomic as well as macroeconomic effects on the economy.

    • can increase the potential output of an economy but not its trend rate of growth.

    • cannot be used to correct market failures and improve the operation of markets.

    • do not affect competitiveness or the current account of the balance of payments.

    121 mark

    At the end of the previous financial year, a country had a national debt of £20 000 billion. The government’s planned expenditure for the current year exceeds its projected income by £100 billion.

    All other things being equal, which one of the following is most likely to enable the government to complete its planned expenditure and reduce the national debt?

    Increasing its

    • planned borrowing by more than £100 billion.

    • projected income and borrowing by £100 billion

    • projected income by £100 billion and reducing new borrowing by £100 billion.

    • projected tax revenue by more than £100 billion.

    131 mark

    All other things being equal, which one of the following is the most likely consequence of technological innovation in the production process by the firms within an industry?

    • A decrease in the number of firms in the industry

    • A reduction in firms’ unit costs of production

    • The elimination of entry barriers into the industry

    • The invention of a product that did not previously exist

    141 mark

    Which one of the following is a role of the UK’s Office for Budget Responsibility?

    • Deciding how much public funding is given to each government department

    • Enabling the government to run a budget deficit by issuing government bonds

    • Evaluating the government’s performance against its own fiscal targets

    • Making recommendations to the government on how to reduce its budget deficit

    151 mark

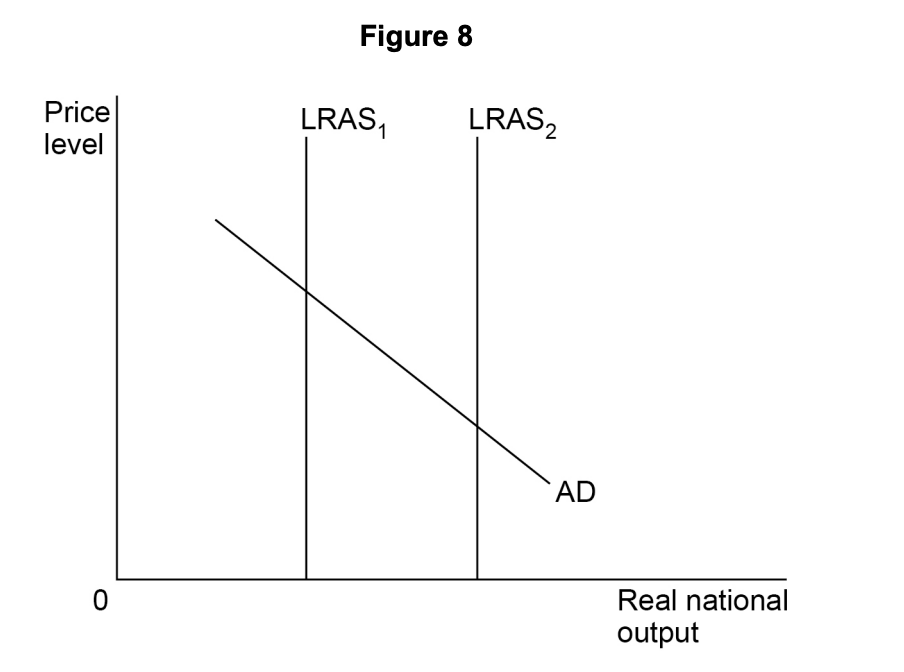
    Figure 8 shows the aggregate demand curve (AD) and the long-run aggregate supply curves (LRAS) for an economy.

    A redistribution of government spending from spending on welfare towards the funding of research and development shifts the long-run aggregate supply curve from LRAS1 to LRAS2

    Graph showing LRAS shift from LRAS1 to LRAS2, with AD curve sloping downwards, indicating changes in real national output and price level.

    Which one of the following is the most likely effect of this policy?

    • A decrease in the number of people who are economically active

    • An improvement in the balance of payments on current account

    • An increase in the size of the government’s budget deficit

    • The creation of a positive output gap

    161 mark

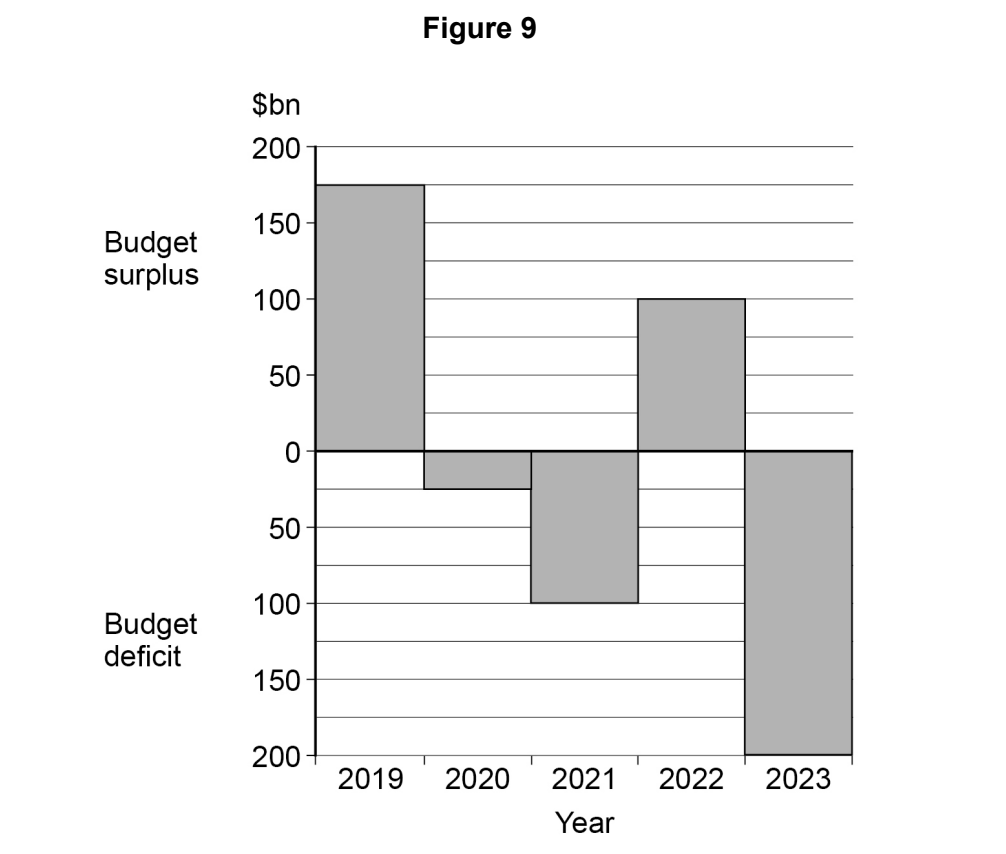
    Figure 9 shows the government budget balance for an economy from 2019 to 2023.

    Bar chart titled Figure 9 showing budget surplus or deficit from 2019 to 2023 in billion dollars, with surpluses in 2019 and 2022, deficits in other years.

    All other things being equal, between 2019 and 2023, the national debt of this economy increased by

    • $50bn

    • $200bn

    • $275bn

    • $325bn

    171 mark

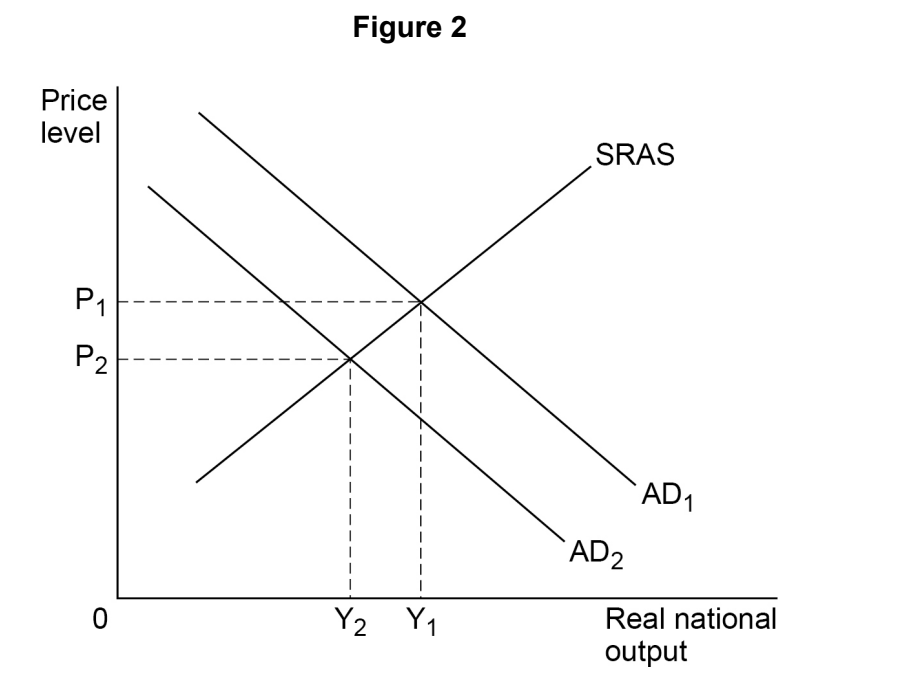
    Figure 2 shows two aggregate demand (AD1 and AD2) curves and the short-run aggregate supply (SRAS) curve for an economy.

    Economic graph showing SRAS, AD1, and AD2 intersecting. Price levels P1 and P2 on the y-axis; real national output Y1 and Y2 on the x-axis.

    Which one of the following is the government most likely to increase if it wishes to use fiscal policy to reduce national output from Y1 to Y2?

    • Infrastructure expenditure

    • Interest rates

    • Rates of income tax

    • The budget deficit

    181 mark

    Which one of the following is a supply-side policy aimed at reducing the natural rate of unemployment?

    • Government retraining schemes for structurally unemployed workers

    • Increasing legal protection against unfair dismissal for employees

    • Increasing the real value of the national minimum wage

    • New government subsidies for developers of artificial intelligence

    191 mark

    Table 2 shows the amount paid in tax by individuals at different levels of income.

    Table 2

    Income (£)

    Tax paid (£)

    20000

    4 000

    30000

    5400

    40000

    6400

    50000

    7000

    This tax is an example of a

    • lump sum tax.

    • progressive tax.

    • proportional tax.

    • regressive tax.

    201 mark

    A government introduces a number of supply box -side policies that increase the size of the country's working population and labour productivity. All other things being equal, which one of the following statements identifies the most likely effects of the policies on the country's economy?

    • An increase in real national income and a reduction in the balance of payments deficit

    • An increase in short-run economic growth and inflation

    • An increase in the trend rate of economic growth and a growing balance of payments deficit

    • A reduction in unemployment and an increase in inflation

    211 mark

    Table 5 shows a household's income and the amount the household has to pay in tax for three taxes

    Table 5

    Income (£)

    Tax F (£)

    Tax G (£)

    Tax H (£)

    10 000

    1000

    500

    500

    30000

    2500

    1500

    1800

    60000

    4000

    3000

    4000

    Which one of the following statements is correct?

    • Tax F is a progressive tax and Tax H is a progressive tax

    • Tax F is a regressive tax and Tax G is a progressive tax

    • Tax F is a regressive tax and Tax G is a proportional tax

    • Tax F is a regressive tax and Tax H is a regressive tax

    221 mark

    Table 6 shows the national debt and gross domestic product (GDP) for the UK in the second quarters of 2020 and 2022.

    Year

    National debt (£bn)

    GDP (£bn)

    2020

    2069

    2190

    2022

    2437

    2391

    All other things being equal, which one of the following is most likely to help the government manage the impact of the changes shown in Table 6?

    • Contractionary monetary policy by the Bank of England

    • Falling demand for government bonds from foreign investors

    • Rising interest rates in global financial markets

    • Sustained rises in nominal national income in future years