Inventory Control (AQA AS Business): Revision Note
Exam code: 7131

The importance of effective inventory control
Inventory is everything a business owns today for the purpose of selling tomorrow
It is sometimes called stock, and the terms are used interchangeably
Businesses hold inventory for immediate use in production or to distribute without delay to customers
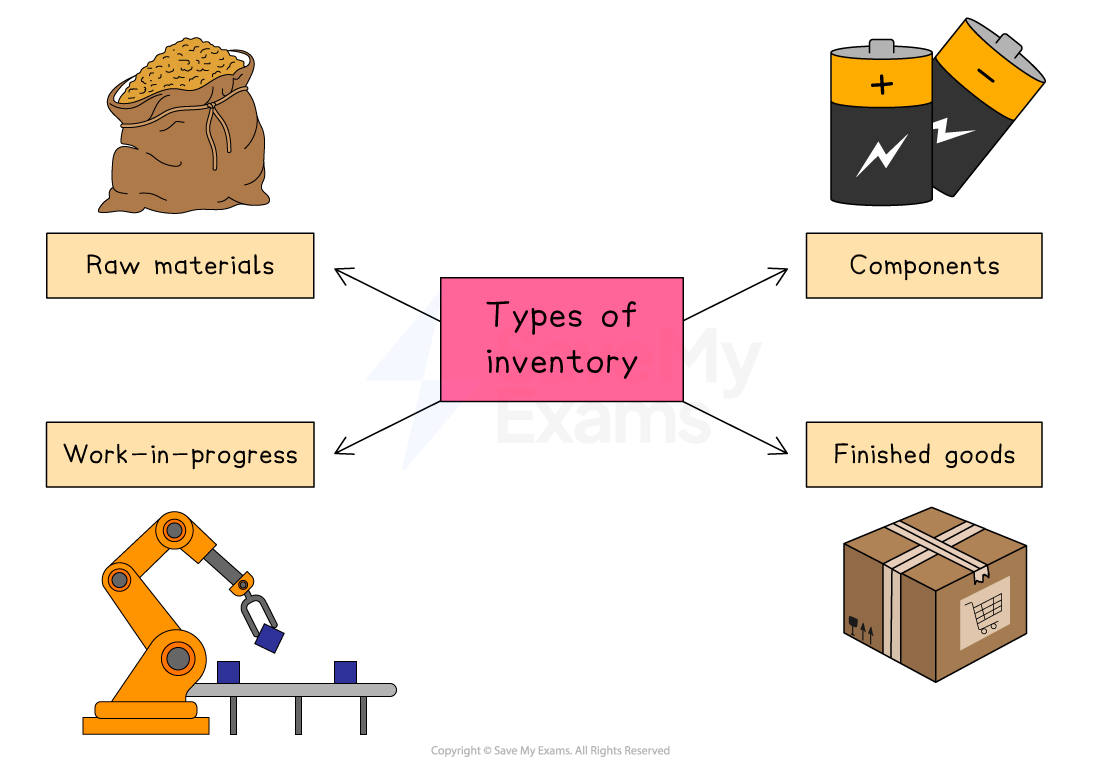
Types of inventory
Type | Description | Example |
|---|---|---|
Raw materials |
|
|
Components |
|
|
Work-in-progress |
|
|
Finished goods |
|
|
Influences on the level of inventory
Demand variability
The more sales fluctuate, the more buffer stock may be needed
Lead-time length and reliability
Long or unpredictable supplier lead times force firms to carry extra inventory
Product perishability
Goods that spoil quickly must be ordered in smaller batches
Storage capacity and cost
Limited warehouse space or high rent encourages lower inventory levels
Inventory control charts
Inventory control involves carefully planning and controlling inventory flow to ensure that enough raw materials, work-in-progress and components are available to meet production demands
An inventory control diagram shows how inventory moves into and out of a business over time
An inventory control diagram
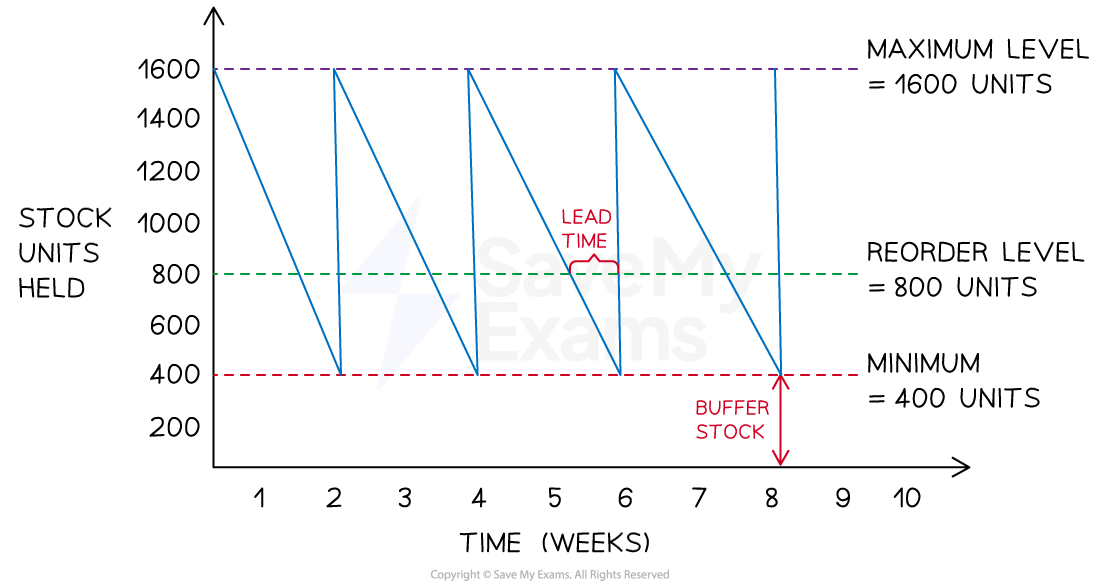
Diagram analysis
The maximum inventory level is the maximum amount of stock a business is able to hold in normal circumstances (1,600)
The reorder level is the level at which a business places a new order with its supplier (800)
The minimum stock level is also known as the buffer stock level and is the lowest level to which a business is willing to allow inventory levels to fall (400)
The lead time is the length of time from the point of inventory being ordered from the supplier to it being delivered (one week)
The stock level line shows how inventory levels change over the given time period
As inventory is used up, a downwards slope is plotted
When an order is delivered by a supplier, the stock level line shoots upwards
Examiner Tips and Tricks
For inventory control charts, show how reorder level, lead time and buffer stock work together — many students mix them up
Worked Example
The diagram below shows inventory movements of kitchen shelving units sold by TamFix Limited.
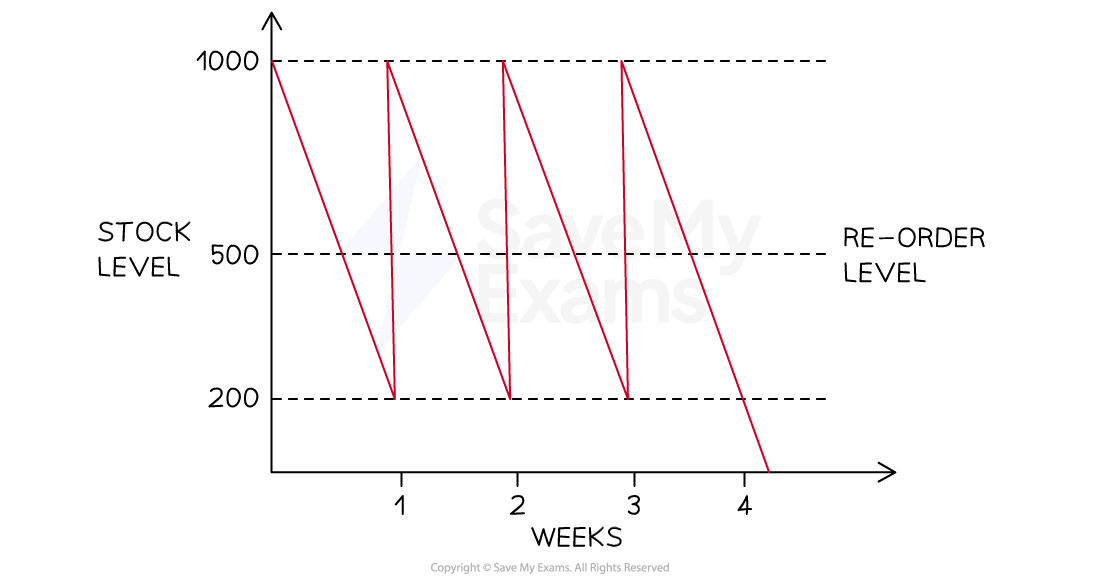
Identify the following points:
The minimum stock level
The reorder level
The reorder quantity
The lead time for kitchen shelving units
[4 marks]
Answer:
Step 1: Identify the minimum stock level
The minimum stock level is identified by the bottommost dotted line
In this case, it shows that the minimum stock level is 200 units (1)
Step 2: Identify the reorder level
The reorder level is clearly identified on the diagram
In this case, it shows that the reorder level is 500 units (1)
Step 3: Identify the reorder quantity
The reorder quantity is the difference between the maximum stock level (shown by the topmost dotted line) and the minimum stock level
format('truetype')%3Bfont-weight%3Anormal%3Bfont-style%3Anormal%3B%7D%3C%2Fstyle%3E%3C%2Fdefs%3E%3Ctext%20font-family%3D%22math143f4d31b04031e49f5eb18baba%22%20font-size%3D%2216%22%20text-anchor%3D%22middle%22%20x%3D%228.5%22%20y%3D%2216%22%3E%3D%3C%2Ftext%3E%3Ctext%20font-family%3D%22Times%20New%20Roman%22%20font-size%3D%2218%22%20text-anchor%3D%22middle%22%20x%3D%2239.5%22%20y%3D%2216%22%3E1000%3C%2Ftext%3E%3Ctext%20font-family%3D%22Times%20New%20Roman%22%20font-size%3D%2218%22%20text-anchor%3D%22middle%22%20x%3D%2278.5%22%20y%3D%2216%22%3Eunits%3C%2Ftext%3E%3Ctext%20font-family%3D%22math143f4d31b04031e49f5eb18baba%22%20font-size%3D%2216%22%20text-anchor%3D%22middle%22%20x%3D%22108.5%22%20y%3D%2216%22%3E%26%23x2212%3B%3C%2Ftext%3E%3Ctext%20font-family%3D%22Times%20New%20Roman%22%20font-size%3D%2218%22%20text-anchor%3D%22middle%22%20x%3D%22134.5%22%20y%3D%2216%22%3E200%3C%2Ftext%3E%3Ctext%20font-family%3D%22Times%20New%20Roman%22%20font-size%3D%2218%22%20text-anchor%3D%22middle%22%20x%3D%22169.5%22%20y%3D%2216%22%3Eunits%3C%2Ftext%3E%3Ctext%20font-family%3D%22math143f4d31b04031e49f5eb18baba%22%20font-size%3D%2216%22%20text-anchor%3D%22middle%22%20x%3D%228.5%22%20y%3D%2263%22%3E%3D%3C%2Ftext%3E%3Ctext%20font-family%3D%22Times%20New%20Roman%22%20font-size%3D%2218%22%20text-anchor%3D%22middle%22%20x%3D%2234.5%22%20y%3D%2263%22%3E800%3C%2Ftext%3E%3Ctext%20font-family%3D%22Times%20New%20Roman%22%20font-size%3D%2218%22%20text-anchor%3D%22middle%22%20x%3D%2269.5%22%20y%3D%2263%22%3Eunits%3C%2Ftext%3E%3C%2Fsvg%3E)
The reorder quantity is, therefore, 800 units (1)
Step 4: Identify the lead time for kitchen shelving units
The lead time is the difference in time between the time an order is placed and the time the inventory is delivered
In this case, assuming a five-day working week, the lead time for shelving units is two days (1)
Examiner Tips and Tricks
Always clearly label your lead time, reorder level and buffer stock, and include units
Show your workings — examiners award method marks even if the final figure is off
The implications of poor inventory control

Problems may arise from holding too much inventory
Storage costs (e.g. warehouse rental, security costs) will be higher than necessary
The risk of inventory shrinkage or spoilage is increased
Excess inventory may need to be sold at a lower price, reducing revenue
Similarly, holding too little inventory is risky
A business may run out of inventory, resulting in production stoppages and higher unit costs due to underused capacity
A business may not be capable of meeting a sudden increase in demand

Unlock more, it's free!
Join the 100,000+ Students that ❤️ Save My Exams
the (exam) results speak for themselves:

Was this revision note helpful?
