Emission & Absorption Spectrum (DP IB Physics: SL): Revision Note

Written by: Katie M
Updated on
Spectra & Atomic Energy Levels
Atomic spectra are observed when atoms emit or absorb light of certain wavelengths
These are known as emission spectra and absorption spectra
Atomic spectra provide evidence that electrons in atoms can only transition between discrete atomic energy levels
Emission Spectra
Emission spectra can be produced by heating a low-pressure gas
Heating provides energy to excite electrons to higher energy levels
When an electron transitions back to a lower energy level, it emits a photon
Each transition corresponds to a specific wavelength of light which correlates to an observable spectral line
The resulting emission spectrum contains a set of discrete wavelengths, represented by coloured lines on a black background
Emission spectrum of hydrogen gas

A typical hydrogen emission spectrum contains several spectral lines in the visible region of the electromagnetic spectrum
Absorption Spectra
Absorption spectra can be produced by passing white light through a cool, low-pressure gas
Only photons with the exact energy required to excite electrons will be absorbed
Each absorbed photon corresponds to a specific wavelength of light which correlates to an observable dark line in a continuous spectrum of wavelengths
The resulting absorption spectrum contains a set of discrete wavelengths, represented by dark lines on a coloured background
These lines correspond to the same lines observed on an emission spectrum for the same element
Absorption spectrum of hydrogen gas
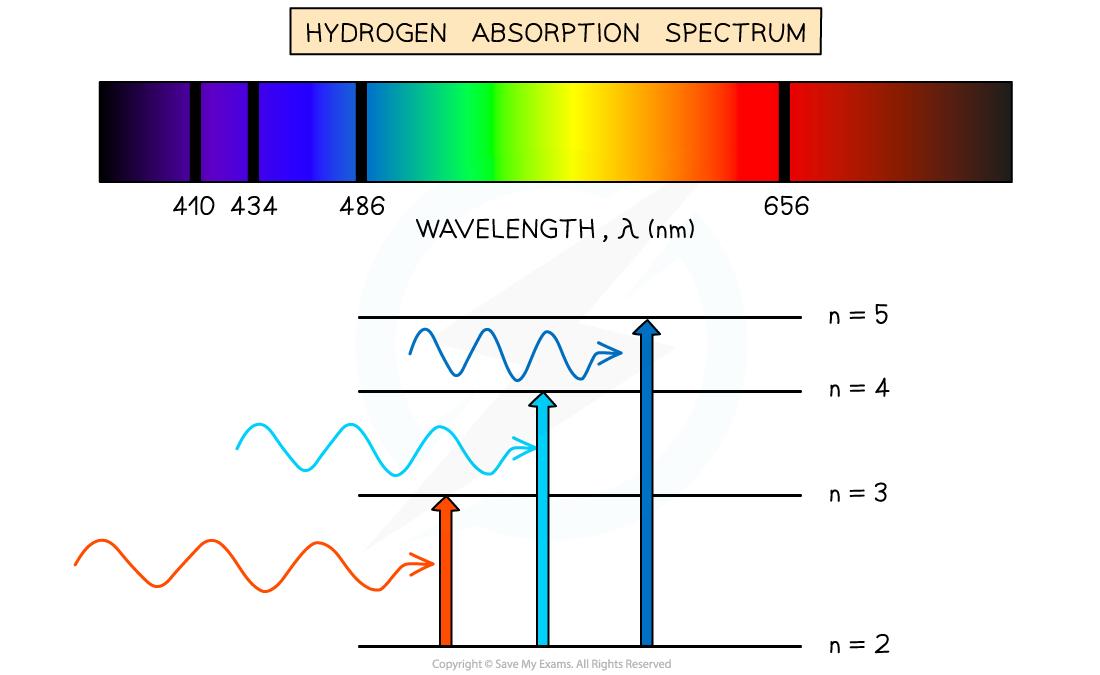
A typical hydrogen absorption spectrum is the inverse of its emission spectrum
Spectra & Chemical Composition
The chemical composition of a substance can be investigated using emission and absorption spectra
Each element produces a unique pattern of spectral lines
No two elements produce the same set of spectral lines, therefore, elements can be identified by their atomic spectrum
Emission spectra of different elements

Emission line spectra are unique to each element, like a fingerprint
For example:
Hydrogen is known to produce strong spectral lines in the red portion of the visible spectrum, at 656 nm
When sodium is burned, a characteristic yellow flame is observed due to it producing strong spectral lines in the yellow portion of the spectrum, at 589 nm
When mercury is burned, most of the emission lines are below 450 nm, which produces a characteristic blue light
Elements such as sodium and mercury are known for their use in street lights, as well as neon for its use in colourful signs
This can be achieved when
An electrical discharge is applied to the vapourised substance
The energy supplied excites orbital electrons within individual atoms to a higher energy state
When the electrons move back down to the ground state, a specific wavelength of light is emitted

Unlock more, it's free!
Join the 100,000+ Students that ❤️ Save My Exams
the (exam) results speak for themselves:

Was this revision note helpful?