The Hertzsprung–Russell (HR) Diagram (DP IB Physics: SL): Revision Note

The Hertzsprung–Russell (HR) Diagram
Danish astronomer Ejnar Hertzsprung, and American astronomer Henry Norris Russell, independently plotted the luminosity of different stars against their temperature
Luminosity (total power emitted), relative to the Sun, on the y-axis, goes from less luminous (at the bottom) to more luminous (at the top)
Temperature, in kelvin (K), on the x-axis, goes from hot (on the left) to cool (on the right)
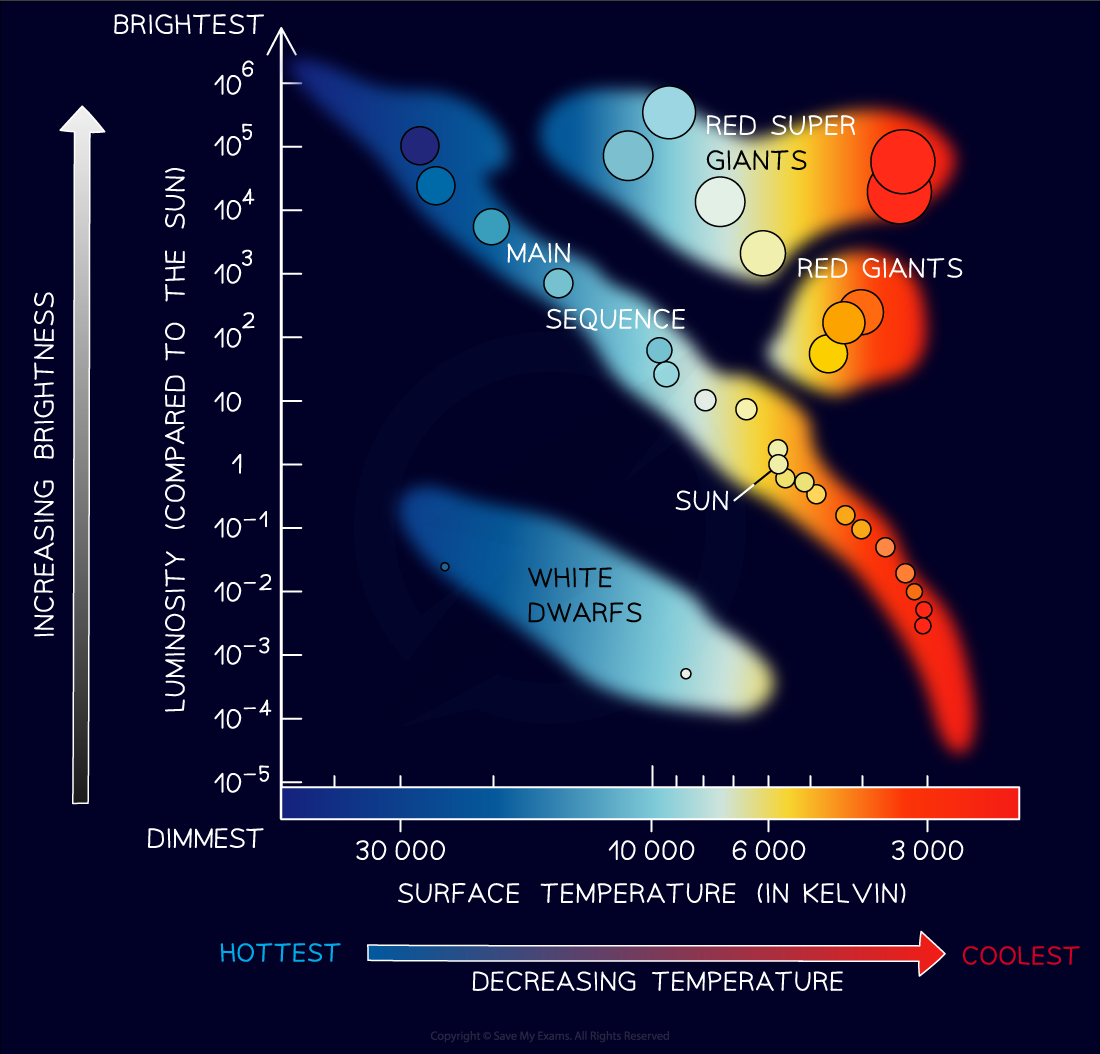
The Hertzsprung-Russell Diagram depicts the luminosity of stars against their temperature
Hertzsprung and Russell found that the stars clustered in distinct areas
Most stars are clustered in a band called the main sequence
For main sequence stars, luminosity increases with surface temperature
A smaller number of stars clustered above the main sequence in two areas, red giants, and red supergiants
These stars show an increase in luminosity at cooler temperatures
The only explanation for this is that these stars are much larger than main sequence stars
Below and to the left of the main sequence are the white dwarf stars
These stars are hot, but not very luminous
Therefore, they must be much smaller than main sequence stars
The Hertzsprung-Russell Diagram only shows stars that are in stable phases
Transitory phases happen quickly in relation to the lifetime of a star
Black holes cannot be seen since they emit no light
Worked Example
Stars can be classified using the Hertzsprung-Russell (H-R) Diagram.

(a) State the types of stars found in areas A, B, C and D
(b) On the H-R diagram, plot the star with a surface temperature of 20 000 K and a luminosity 10 000 times greater than the Sun and label it Star X.
Answer:
(a)
Step 1: Identify the main sequence on the HR diagram
The main sequence is the easiest to recognise as it is the long band diagonally central to the diagram where the majority of stars are found
The main sequence is region B
Step 2: Identify the white dwarf region on the HR diagram
White dwarf stars are hot, but not very luminous
Identify the area with a lower luminosity than the main sequence
The white dwarf region is area A
Step 3: Identify the red giant and red supergiant regions on the HR diagram
Red giants and super red giants have a greater luminosity than main sequence stars at a lower temperature
That means that they are bigger than main sequence stars
The bigger they are, the more luminous they are
So, the super red giants are more luminous than the red giants and will appear above them on the graph
The super red giant region is area C
The red giant region is area D
(b)
Step 1: List the known quantities
Surface temperature of Star X = 20 000 K
Luminosity of Star X = 10 000 times that of the Sun
Step 2: Use the graph to find the value for the luminosity of the Sun
Use a ruler and pencil to draw a line from the position of the sun to the luminosity axis (y-axis)
The Sun’s luminosity on this scale is 1 because the luminosities given are relative to the luminosity of the sun

Step 3: Calculate the luminosity of Star X
Star X is 10 000 times that of the Sun
The luminosity of the Sun is 1
10 000 × 1 = 10 000 or 104
Step 4: Plot the position of Star X on the HR diagram
Locate the surface temperature of Star X at 20 000 K
Locate the luminosity of Star X at 104

Plot the point and label it Star X

Examiner Tips and Tricks
You need to be able to identify the distinct areas of the Hertzsprung-Russell diagram out of context like in this exam question

Unlock more, it's free!
Join the 100,000+ Students that ❤️ Save My Exams
the (exam) results speak for themselves:

Was this revision note helpful?
Build on this topic