Motion Graphs (DP IB Physics): Revision Note
Motion Graphs
The motion of objects can be analysed in terms of position, velocity and acceleration
These are all related to each other by gradients and areas under curves
Three types of graphs that can represent the motion of an object are:
Displacement-time graphs
Velocity-time graphs
Acceleration-time graphs
Displacement-Time Graphs
On a displacement-time graph:
Slope equals velocity
The y-intercept equals the initial displacement
A straight (diagonal) line represents a constant velocity
A curved line represents an acceleration
A positive slope represents motion in the positive direction
A negative slope represents motion in the negative direction
A zero slope (horizontal line) represents a state of rest
The area under the curve is meaningless
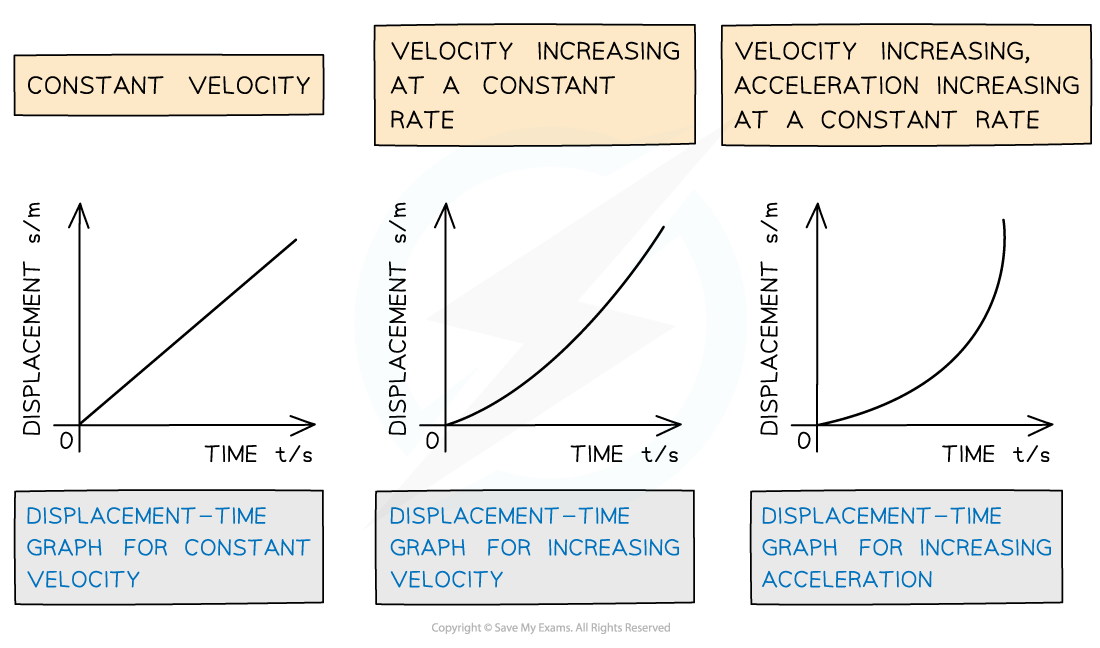
Displacement-time graphs displacing different values of velocity
Velocity-Time Graphs
On a velocity-time graph:
Slope equals acceleration
The y-intercept equals the initial velocity
A straight (diagonal) line represents uniform acceleration
A curved line represents non-uniform acceleration
A positive slope represents acceleration in the positive direction
A negative slope represents acceleration in the negative direction
A zero slope (horizontal line) represents motion with constant velocity
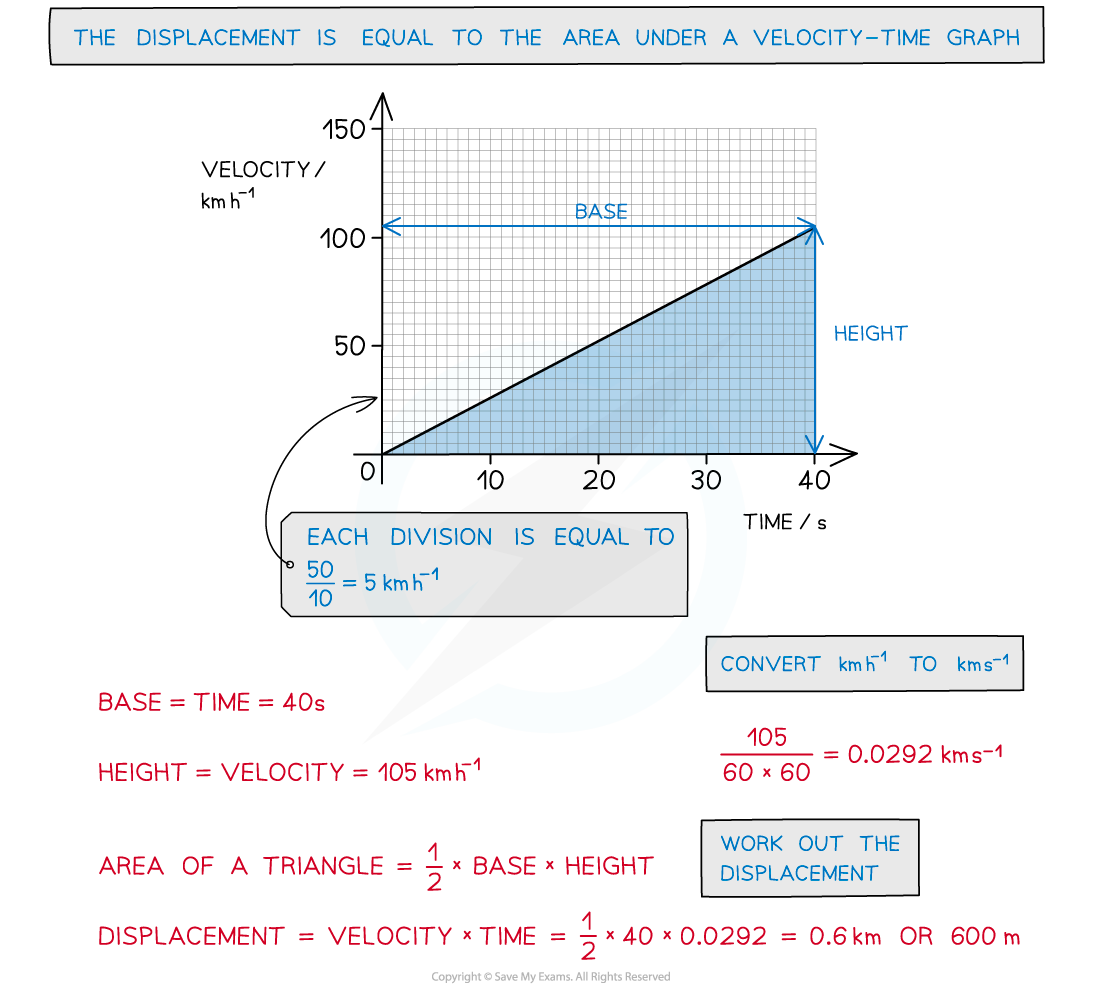
The area under the curve equals the change in displacement
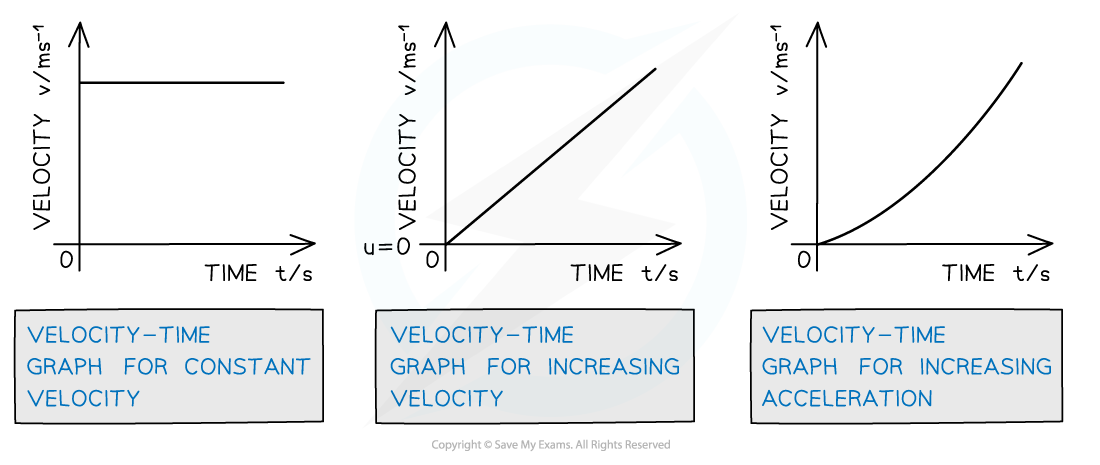
Velocity-time graphs displacing different values of acceleration
Acceleration-Time Graphs
On an acceleration-time graph:
Slope is meaningless
The y-intercept equals the initial acceleration
A zero slope (horizontal line) represents an object undergoing constant acceleration
The area under the curve equals the change in velocity
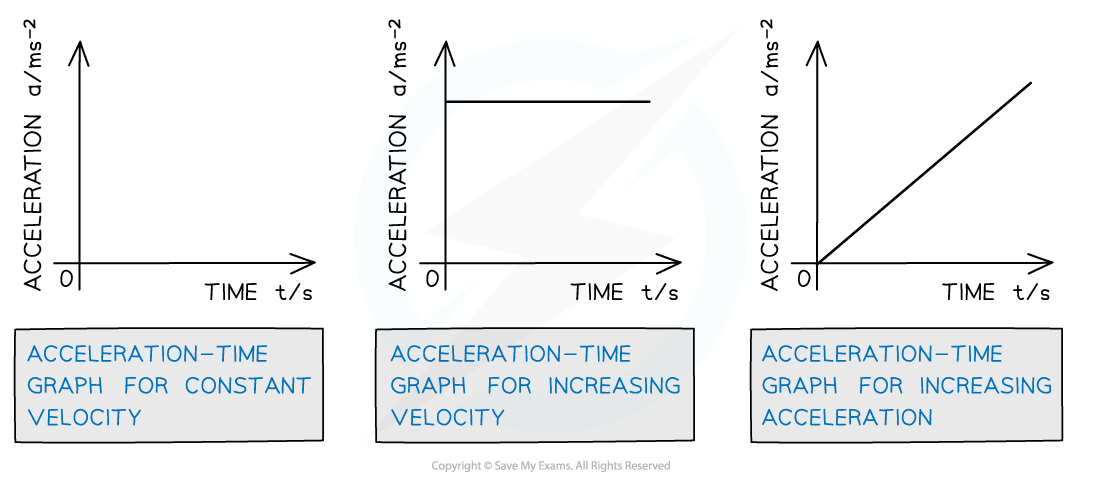
How displacement, velocity and acceleration graphs relate to each other
Acceleration can either be
Uniform i.e. a constant value. For example, acceleration due to gravity on Earth
Non-uniform i.e. a changing value. For example, an object with increasing acceleration
Motion of a Bouncing Ball
For a bouncing ball, the acceleration due to gravity is always in the same direction (in a uniform gravitational field such as the Earth's surface)
This is assuming there are no other forces on the ball, such as air resistance
Since the ball changes its direction when it reaches its highest and lowest point, the direction of the velocity will change at these points
The vector nature of velocity means the ball will sometimes have a:
Positive velocity if it is travelling in the positive direction
Negative velocity if it is traveling in the negative direction
An example could be a ball bouncing from the ground back upwards and back down again
The positive direction is taken as upwards
This will be either stated in the question or can be chosen, as long as the direction is consistent throughout
Ignoring the effect of air resistance, the ball will reach the same height every time before bouncing from the ground again
When the ball is traveling upwards, it has a positive velocity which slowly decreases (decelerates) until it reaches its highest point
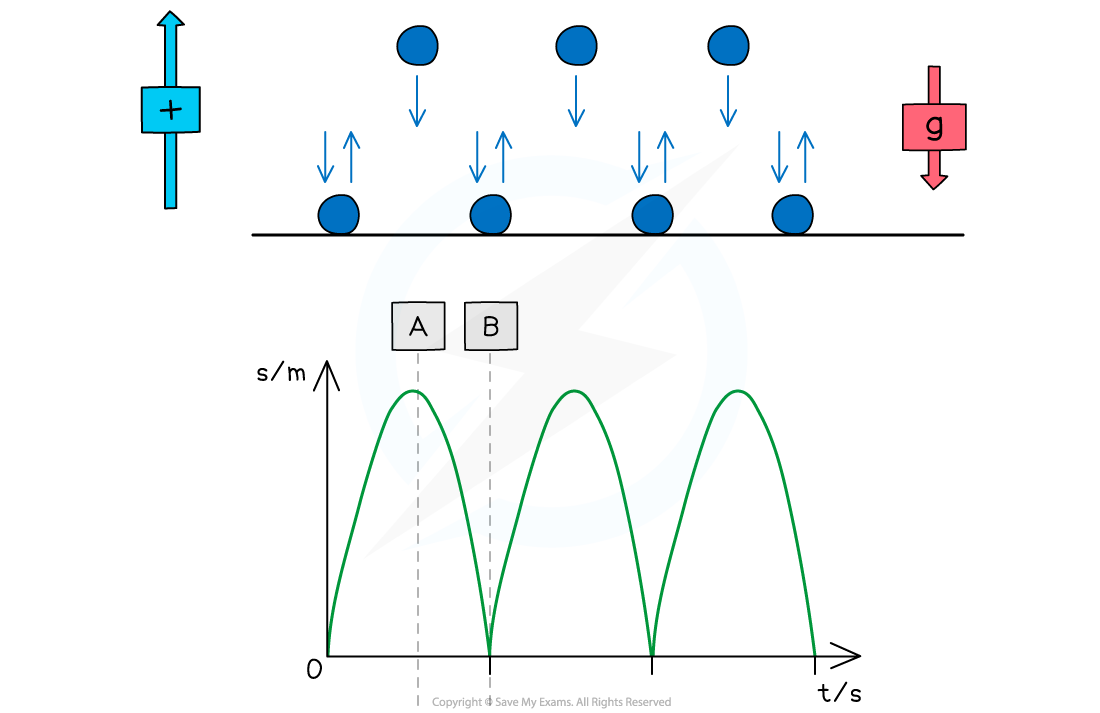
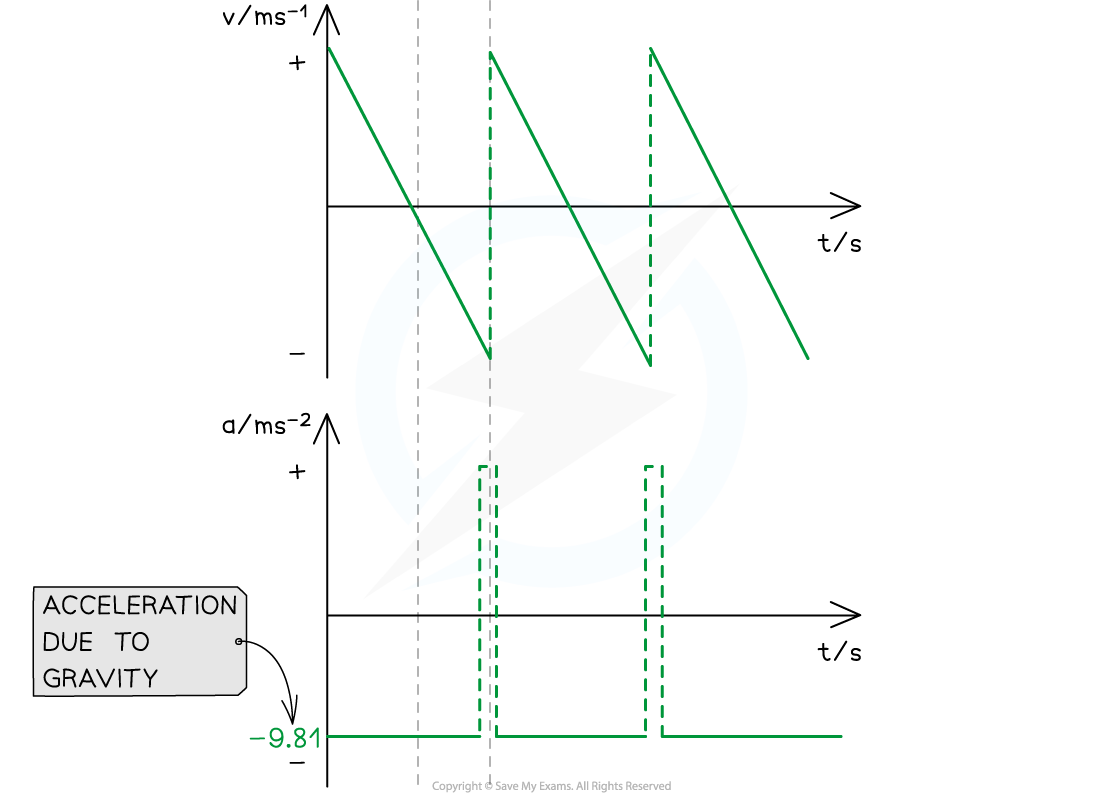
At point A (the highest point):
The ball is at its maximum displacement
The ball momentarily has zero velocity
The velocity changes from positive to negative as the ball changes direction
The acceleration, g, is still constant and directed vertically downwards
At point B (the lowest point):
The ball is at its minimum displacement (on the ground)
Its velocity changes instantaneously from negative to positive, but its speed (magnitude) remains the same
The change in direction causes a momentary acceleration (since acceleration = change in velocity / time)
Worked Example
Tora is training for a cycling tournament.
The velocity-time graph below shows her motion as she cycles along a flat, straight road.
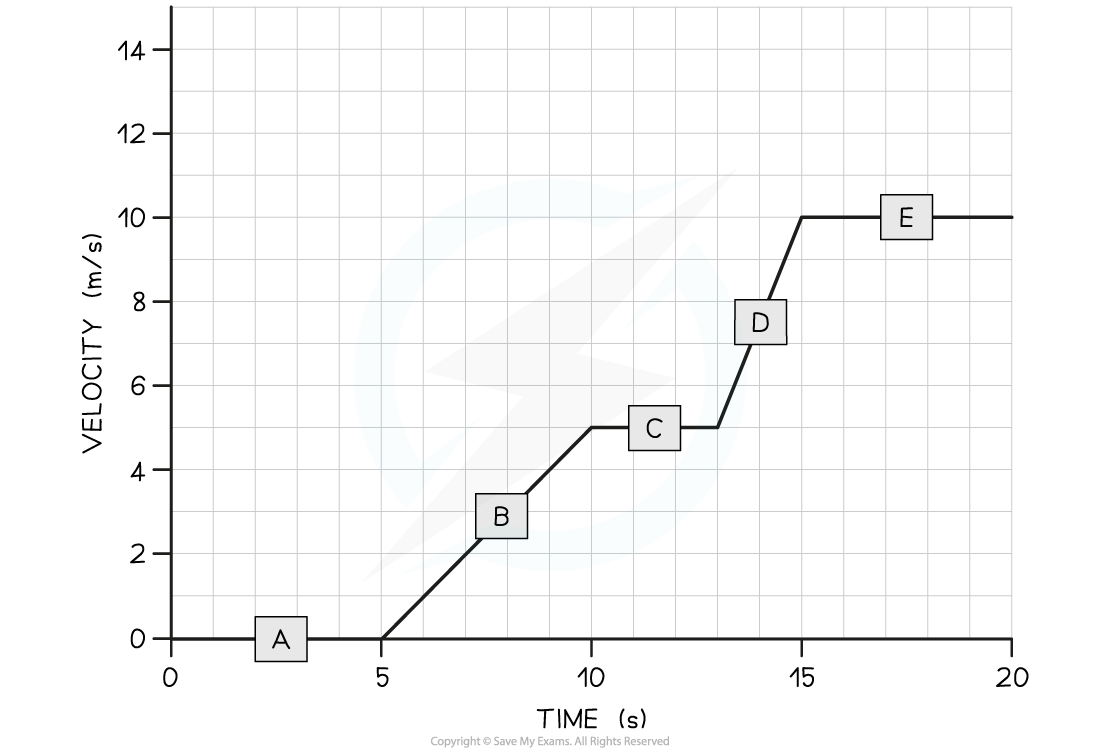
(a) In which section (A, B, C, D, or E) of the velocity-time graph is Tora’s acceleration the largest?
(b) Calculate Tora’s acceleration between 5 and 10 seconds.
Answer:
(a)
Step 1: Recall that the slope of a velocity-time graph represents the magnitude of acceleration
The slope of a velocity-time graph indicates the magnitude of acceleration
Therefore, the only sections of the graph where Tora is accelerating is section B and section D
Sections A, C, and E are flat – in other words, Tora is moving at a constant velocity (i.e. not accelerating)
Step 2: Identify the section with the steepest slope
Section D of the graph has the steepest slope
Hence, the largest acceleration is shown in section D
(b)
Step 1: Recall that the gradient of a velocity-time graph gives the acceleration
Calculating the gradient of a slope on a velocity-time graph gives the acceleration for that time period
Step 2: Draw a large gradient triangle at the appropriate section of the graph
A gradient triangle is drawn for the time period between 5 and 10 seconds below:
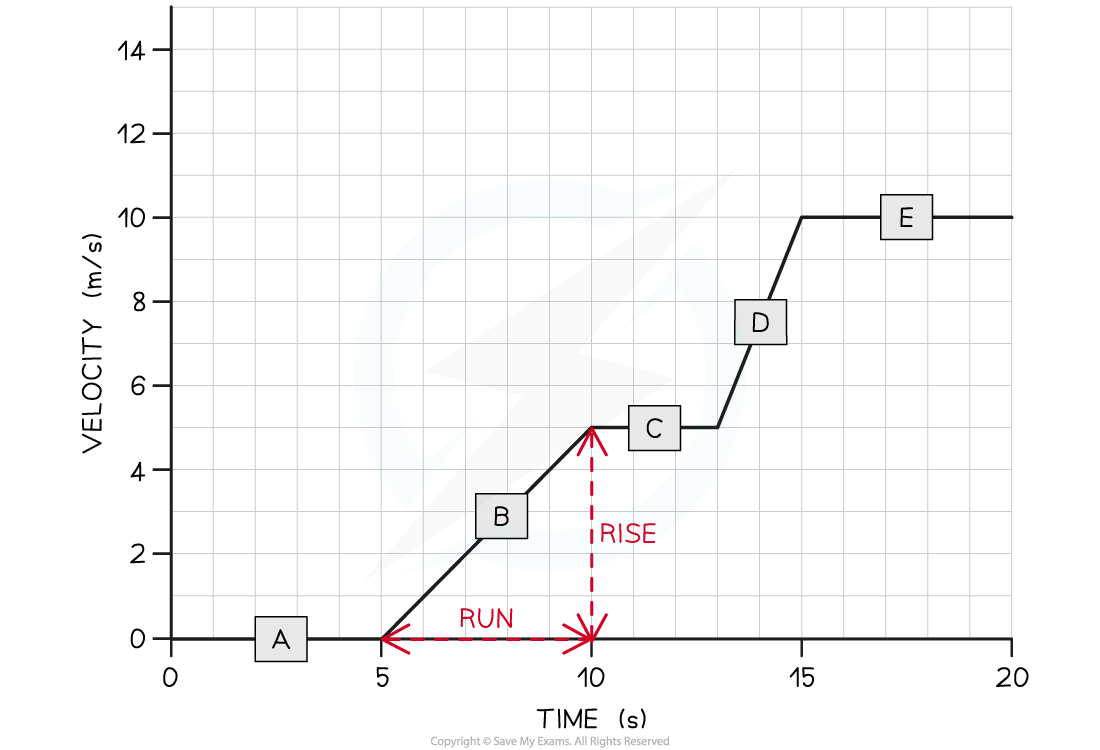
Step 3: Calculate the size of the gradient and state this as the acceleration
The acceleration is given by the gradient, which can be calculated using:
![]()
Therefore, Tora accelerated at 1 m s−2 between 5 and 10 seconds
Worked Example
The velocity-time graph of a vehicle travelling with uniform acceleration is shown in the diagram below.
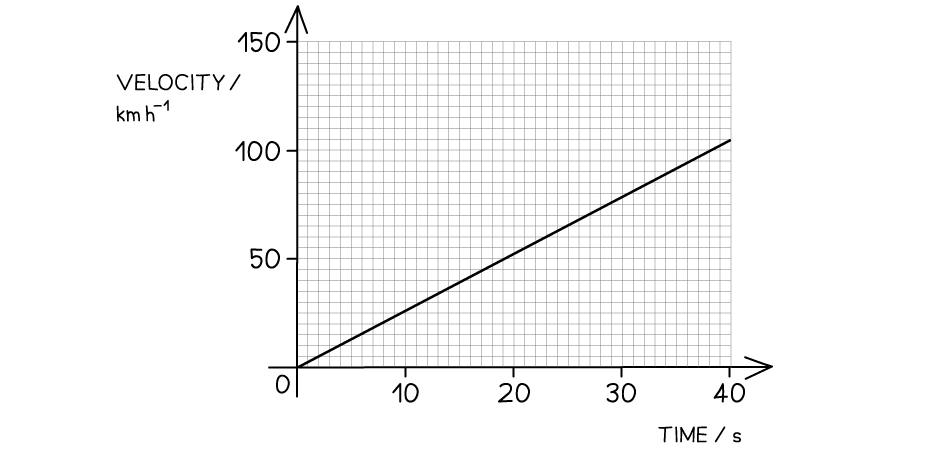
Calculate the displacement of the vehicle at 40 s.
Answer:

Unlock more, it's free!
Did this page help you?