Random & Systematic Errors (DP IB Physics): Revision Note

Random & Systematic Errors
Measurements of quantities are made with the aim of finding the true value of that quantity
In reality, it is impossible to obtain the true value of any quantity as there will always be a degree of uncertainty
The uncertainty is an estimate of the difference between a measurement reading and the true value
The two types of measurement errors that lead to uncertainty are:
Random errors
Systematic errors
Random Errors
Random errors cause unpredictable fluctuations in an instrument’s readings as a result of uncontrollable factors, such as environmental conditions
This affects the precision of the measurements taken, causing a wider spread of results about the mean value
To reduce random error:
Repeat measurements several times and calculate an average from them
Reading Errors
When measuring a quantity using an analogue device such as a ruler, the uncertainty in that measured quantity is ±0.5 the smallest measuring interval
When measuring a quantity using a digital device such as a digital scale or stopwatch, the uncertainty in that measured quantity is ±1 the smallest measuring interval
To reduce reading errors:
Use a more precise device with smaller measuring intervals and therefore less uncertainty

Both rulers measure the same candy cane, yet Ruler B is more precise than Ruler A due to a smaller interval size
Systematic Errors
Systematic errors arise from the use of faulty instruments or from flaws in the experimental method
This type of error is repeated consistently every time the instrument is used or the method is followed, which affects the accuracy of all readings obtained
To reduce systematic errors:
Instruments should be recalibrated, or different instruments should be used
Corrections or adjustments should be made to the technique
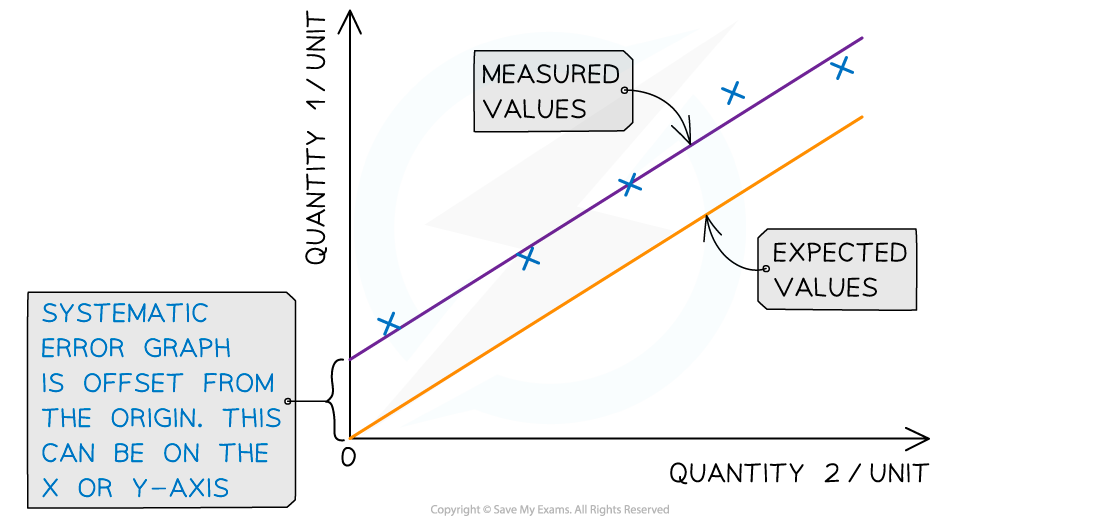
Systematic errors on graphs are shown by the offset of the line from the origin
Zero Errors
This is a type of systematic error which occurs when an instrument gives a reading when the true reading is zero
For example, a top-ban balance that starts at 2 g instead of 0 g
To account for zero errors
Take the difference of the offset from each value
For example, if a scale starts at 2 g instead of 0 g, a measurement of 50 g would actually be 50 – 2 = 48 g
The offset could be positive or negative
Precision
Precise measurements are ones in which there is very little spread about the mean value, in other words, how close the measured values are to each other
If a measurement is repeated several times, it can be described as precise when the values are very similar to, or the same as, each other
Another way to describe this concept is if the random uncertainty of a measurement is small, then that measurement can be said to be precise
The precision of a measurement is reflected in the values recorded – measurements to a greater number of decimal places are said to be more precise than those to a whole number
Accuracy
A measurement is considered accurate if it is close to the true value
Another way to describe this concept is if the systematic error of a measurement is small, then that measurement can be said to be accurate
The accuracy can be increased by repeating measurements and finding a mean of the results
Repeating measurements also helps to identify anomalies that can be omitted from the final results

The difference between precise and accurate results

Representing precision and accuracy on a graph
Reliability
Reliability is defined as
A measure of the ability of an experimental procedure to produce the expected results when using the same method and equipment
A reliable experiment is one which produces consistent results when repeated many times
Similarly, a reliable measurement is one which can be reproduced consistently when measured repeatedly
When thinking about the reliability of an experiment, a good question to ask is
Would similar conclusions be reached if someone repeated this experiment?
Validity
The validity of an experiment relates to the experimental method and the appropriate choice of variables
Validity is defined as
A measure of the suitability of an experimental procedure to measure what it is intended to measure
It is essential that any variables that may affect the outcome of an experiment are identified and controlled in order for the results to be valid
For example, when using Charles’ law to determine absolute zero, pressure must be kept constant
When thinking about the validity of an experiment, a good question to ask is
How relevant is this experiment to my original research question?

Unlock more, it's free!
Did this page help you?