Income & Wealth Distribution (AQA A Level Economics): Exam Questions

Exam code: 7136

1 hour10 questions
1
Sme Calculator
1 mark

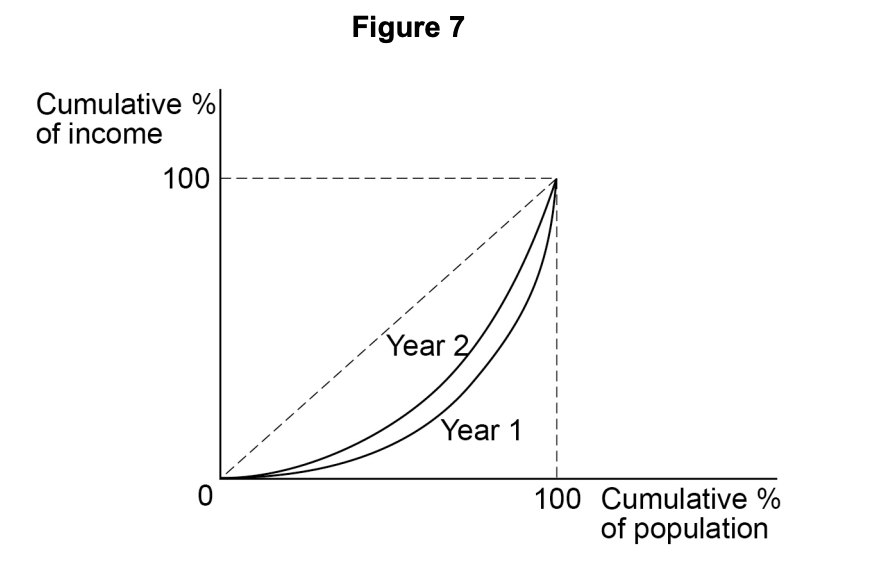
In an economy, over the last decade, each of the top five decile groups has experienced a fall in their share of total income. In contrast, the bottom five decile groups have experienced a substantial increase in their share of total income.

It can be concluded that, over this period, the distribution of income is most likely to have become

  • more equal.

  • more equal but less equitable.

  • more equitable.

  • more equitable but less equal.

2
Sme Calculator
1 mark

All other things being equal, which one of the following would be most likely to result in a reduction in inequality in the distribution of income in the UK?  An increase in the 

  • amount of government tax revenue. 

  • average standard of living. 

  • level of median income.

  • share of income of the lowest quintile.

3
Sme Calculator
1 mark

Which one of the following policies is most likely to have an immediate effect in helping to reduce the amount of poverty in the UK?

  • An increase in government subsidies for buyers of electric cars.

  • A shift in the burden of taxation from direct to indirect taxes 

  • Setting a price floor for basic foods

  • The introduction of a price ceiling for household energy 

4
Sme Calculator
1 mark

The information below shows the changes in key economic indicators for a country over a period of one year. 

Money GDP

Rate of inflation

Population increase

Gini coefficient

+6%

+4%

+1%

-8%

Which one of the following values for the Gini coefficient shows the greatest inequality?

  • -0.5

  • 0

  • 0.5

  • 1

51 mark

Figure 7 shows the income distribution of a country in Year 1 and Year 2

Line graph titled 'Figure 7' shows Lorenz curves for Years 1 and 2. Y-axis: cumulative % of income, X-axis: cumulative % of population.

From Figure 7, it can be concluded that income distribution has become

  • less equal and the Gini coefficient has decreased.

  • less equal and the Gini coefficient has increased.

  • more equal and the Gini coefficient has decreased.

  • more equal and the Gini coefficient has increased

61 mark

Which one of the following best explains the existence of relative poverty?

  • Some households have to pay more in income tax than other households.

  • The Gini coefficient in some countries is low.

  • The income of some households is significantly less than the median household income.

  • The prices of items that are essential for life differ between countries.

71 mark

Table 1 shows the effect of cash benefits and taxes on household incomes in the UK in 2020–21.

Income of top

quintile (£s)

Income of

bottom quintile

(£s)

Ratio of top to

bottom quintile

Original

income

107 551

8 196

13.1

plus cash

benefits

2 581

7 267

0.4

Gross income

110 132

15 463

7.1

less direct

taxes

32 000

2 267

14.1

Disposable

income

78 131

13 196

5.9

less indirect

taxes

7 133

3 024

2.4

Post-tax

income

70 998

10 172

7.0

Which one of the following can be concluded from the data in Table 1 regarding the distribution of income between the top and bottom quintile of households?

  • Cash benefits were less effective than direct taxes in redistributing income from the bottom quintile of households to the top quintile

  • Direct taxes made the distribution of income more unequal

  • Indirect taxes made the distribution of income more unequal

  • Indirect taxes were more effective than cash benefits in redistributing income from the top quintile of households to the bottom quintile