Data-Based Questions (Paper 1B) (DP IB Chemistry: SL): Exam Questions

1 hour6 questions
1a2 marks

A student investigated the enthalpy change of neutralisation by gradually adding aqueous potassium hydroxide (KOH) to a known volume of aqueous ethanoic acid (CH3COOH) in a polystyrene cup. A temperature probe recorded the temperature after each addition.

The following data were obtained:

Volume of KOH added (±0.1 cm3)

0.0

5.0

10.0

15.0

20.0

25.0

30.0

35.0

Temperature (±0.1 °C)

22.5

24.7

26.5

27.8

28.6

28.9

28.7

28.4

(i) Describe the overall trend in the temperature as the volume of KOH increases.

[1]

(ii) Suggest a reason for the slight decrease in temperature after 25.0 cm³ of KOH have been added.

[1]

1b1 mark

A graph of temperature against volume of KOH added was plotted.

Graph showing temperature change from 22°C to 29°C as the volume of KOH increases from 0 to 35 cm³. Temperature initially rises, then stabilises.

Estimate the volume of KOH added at which neutralisation is complete, based on the data.

1c1 mark

The concentration of the ethanoic acid was 1.00 mol dm-3, and the volume used was 25.0 cm3.

Determine the number of moles of ethanoic acid in the cup before titration began.

1d3 marks

The student forgot to record the concentration of the KOH solution.

Describe how the temperature data and the enthalpy change of neutralisation (ΔHneut = –57.0 kJ mol-1) can be used to determine the concentration of the KOH solution.

1e2 marks

Identify one assumption made in the method described in (d), and explain how it could affect the final value obtained.

1f2 marks

Suggest two improvements to the experimental method to reduce heat loss to the surroundings.

Did this page help you?

2a2 marks

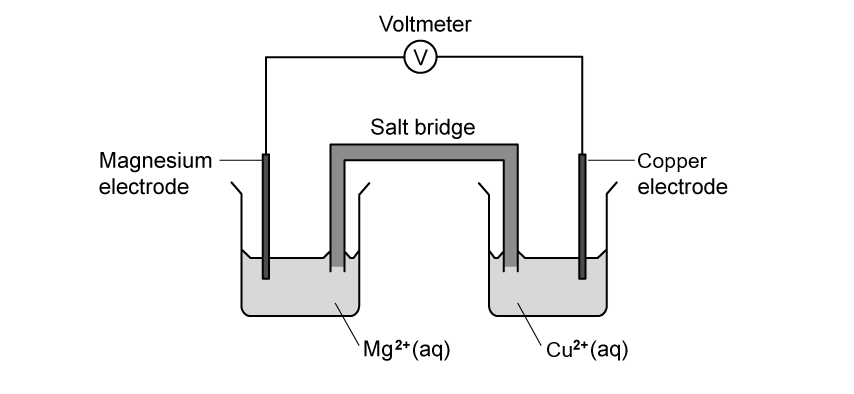
A student investigated how the distance between two electrodes affects the current in a voltaic cell. She used a magnesium electrode and a copper electrode, connected by wires to a voltmeter. Both electrodes were immersed in aqueous potassium nitrate (KNO3) solution.

The experiment was repeated with two different concentrations of KNO3: 0.50 mol dm-3 and 1.00 mol dm-3. For each trial, the student increased the distance between the electrodes from 2.0 cm to 10.0 cm and recorded the current.

A diagram of the setup is shown below.

Diagram of an electrochemical cell with magnesium and copper electrodes in potassium nitrate solution, connected by wires to a voltmeter.

Identify the direction of electron flow in the external circuit and explain your answer.

2b2 marks

(i) Write the half-equation for the reaction occurring at the magnesium electrode.

[1]

(ii) Explain whether the magnesium electrode acts as the anode or cathode.

[1]

2c2 marks

Explain why the current is higher in the 1.00 mol dm-3 KNO3 solution than in the 0.50 mol dm-3 solution.

2d3 marks

The student's results are shown in the graph below.

Graph showing current vs. distance between electrodes for 0.50 and 1.00 mol dm⁻³ KNO₃ solutions. Current decreases as distance increases.

(i) Use the graph to estimate the current for the 1.00 mol dm⁻³ solution when the electrodes are 6.0 cm apart.

[1]

(ii) Calculate the percentage increase in current at 4.0 cm when using the 1.00 mol dm⁻³ solution instead of the 0.50 mol dm⁻³ solution.

[2]

2e2 marks

Explain the shape of the graph using ideas about ion movement and solution resistance.

2f3 marks

The student considered replacing the Mg and Cu electrodes with platinum.

(i) Explain whether this change would improve the reliability of the results.

[2]

(ii) Suggest one controlled variable (other than distance, electrode material, and concentration) that should remain the same in each trial.

[1]

Did this page help you?

3a1 mark

Every winter, road salt is spread on icy surfaces to lower the freezing point of water. A student investigates how the mass of calcium chloride (CaCl2) added to water affects the freezing point of the solution.

In each trial, a measured mass of solid CaCl2 is added to 100 g of distilled water. The solution is stirred and cooled, and the freezing point is recorded.

Write an ionic equation to show how CaCl2 dissociates in water.

3b1 mark

Explain how the dissociation of CaCl2 helps to lower the freezing point of water.

3c3 marks

The table below shows the freezing points recorded during the investigation.

Mass of CaCl2 added / g

Freezing point / oC

0.0

0.0

5.0

–2.6

10.0

–5.1

15.0

–7.5

20.0

–9.8

25.0

–11.6

(i) Describe the trend shown in the data.

[1]

(ii) Calculate the average decrease in freezing point per gram of CaCl2 added.

[2]

3d1 mark

Estimate the freezing point if 30.0 g of CaCl2 were added.

3e2 marks

Explain one reason why your estimate in (d) may not be completely accurate.

3f2 marks

The student later discovers the CaCl2 used was slightly damp and not pure.

Explain how this would affect the results of the experiment.

3g2 marks

A second student suggests:

“The bigger the molar mass of the salt, the more it lowers the freezing point.”

Evaluate this suggestion.

Did this page help you?

4a2 marks

A student investigates the effectiveness of four commercial antacids in reducing stomach acidity. The active ingredients of the antacids are shown below:

Brand

Active ingredients

A

Mg(OH)2, Al(OH)3

B

NaHCO3, CaCO3

C

CaCO3

D

Mg(OH)2, Al2O3

Each tablet is crushed and added to 25.0 cm3 of 1.00 mol dm-3 hydrochloric acid (HCl). After 5 minutes, the final pH is recorded.

(i) Write a balanced chemical equation for the reaction between calcium carbonate and hydrochloric acid.

[1]

(ii) State the formula of one ion produced in the reaction that causes the pH to increase.

[1]

4b2 marks

Suggest two experimental variables, other than time, that should be controlled to ensure a fair comparison between the antacid tablets.

4c2 marks

The results of the experiment are shown below.

Antacid

Dose used

Final pH

A

1 tablet (0.80 g)

3.42

B

1 tablet (1.25 g)

5.01

C

0.5 tablet (0.75 g)

3.48

D

1 tablet (0.95 g)

2.12

(i) Assuming that the initial pH of the acid was 1.00, calculate the change in pH for antacid A.

[1]

(ii) Calculate the uncertainty in the pH change for antacid A, using ±0.02 for each pH value.

[1]

4d2 marks

Explain one reason why antacid B may appear more effective than C, even though both contain calcium carbonate.

4e3 marks

The student concludes that “Antacid B is the most effective.”

Use the data to evaluate this conclusion.

4f1 mark

The student later discovers the antacid B tablet was slightly damp.

Explain how this might affect the result.

4g1 mark

Suggest one environmental concern with using excess antacid tablets that contain carbonate or hydroxide compounds.

Did this page help you?

5a3 marks

A student investigated the effect of temperature on the rate of hydrogen peroxide (H2O2) decomposition using manganese(IV) oxide (MnO2) as a catalyst. The volume of oxygen gas produced in the first 20 seconds was measured at five different temperatures.

2H2O2 (aq) → 2H2O (l) + O2 (g)

Temperature / oC

Volume of O2 produced / cm3

20

6.2

30

10.7

40

15.6

50

22.3

60

23.1

70

23.3

80

23.2

(i) Describe the trend shown in the data.

[1]

(ii) Use particle theory to explain the effect of increasing temperature on the rate of reaction.

[2]

5b3 marks

(i) Calculate the average rate of reaction at 50 oC in cm3 s-1.

[1]

(ii) Calculate the percentage increase in rate when the temperature is raised from 40 oC to 50 oC.

[2]

5c2 marks

Explain why there is only a small increase in rate between 50 oC and 60 oC.

5d3 marks

The student repeats the experiment without MnO2.

(i) Sketch a second curve on the grid below to show how the reaction rate would differ without a catalyst. Label the curve.

Graph showing oxygen volume versus temperature. Volume increases sharply from 20°C to 50°C, then levels off near 20 cm³ from 50°C to 80°C.

[1]

(ii) Explain why the catalyst affects the rate.

[2]

5e1 mark

Suggest one procedural improvement the student could make to increase accuracy in measuring the volume of gas produced.

Did this page help you?

6a2 marks

The graph below shows how the solubility of carbon dioxide (CO2) in water changes with pressure at a constant temperature of 25 oC.

Graph showing a linear increase in the solubility of CO2 in water with pressure, from 0.0 g/100g at 0 atm to 0.8 g/100g at 5 atm.

(i) Describe the trend shown by the graph.

[1]

(ii) State the type of relationship shown between pressure and solubility.

[1]

6b2 marks

Explain the trend using ideas about particle behaviour.

6c2 marks

(i) Use the graph to determine the solubility of CO2 at 2.5 atm.

[1]

(ii) Use the graph to determine the pressure needed for a solubility of 0.580 g per 100 g H2O.

[1]

6d1 mark

Explain why the graph passes through the origin.

6e3 marks

(i) Explain why increasing the temperature would reduce the solubility of CO2 in water.

[2]

(ii) Predict how the graph would look if temperature increased.

[1]

6f1 mark

Suggest one real-world situation that relies on the solubility of gases in liquids.

6g2 marks

Explain why the dissolution of CO2 in water is considered an exothermic process.

Did this page help you?