Graphs of Polynomials (Edexcel IGCSE Further Pure Maths): Revision Note
Exam code: 4PM1

Quadratic Functions & Graphs
What are the key features of quadratic graphs?
A quadratic graph can be written in the form where
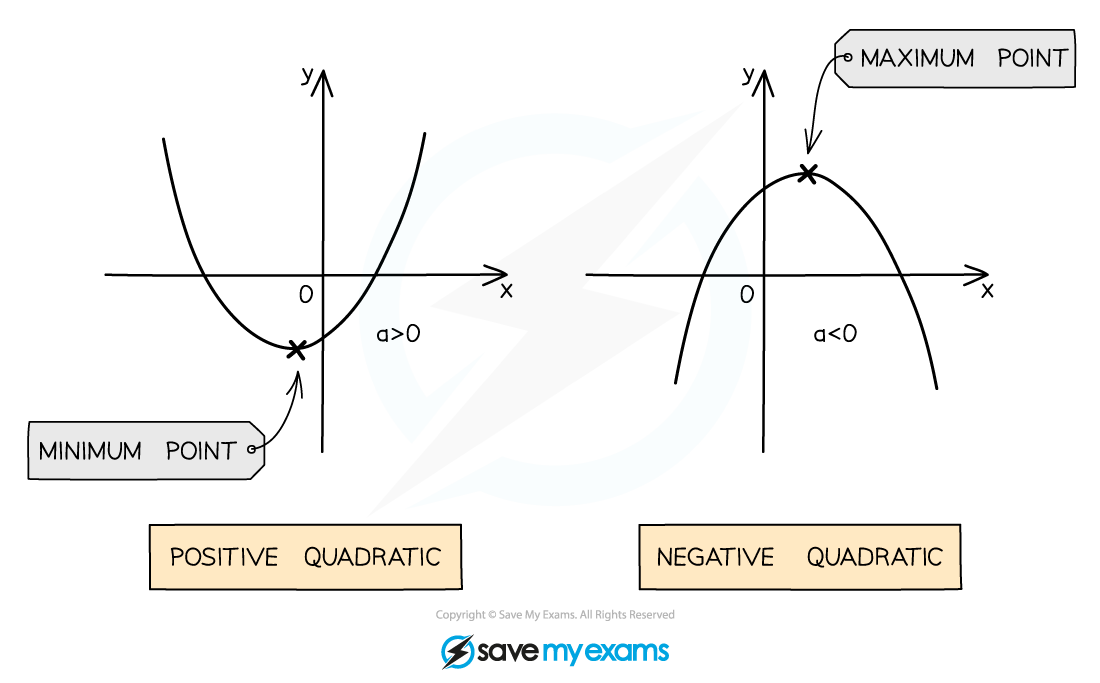
The shape of the graph is known as a parabola
The value of a affects the shape of the curve
If a is positive the shape is 'u-shaped' ∪
If a is negative the shape is 'upside down u-shaped' ∩
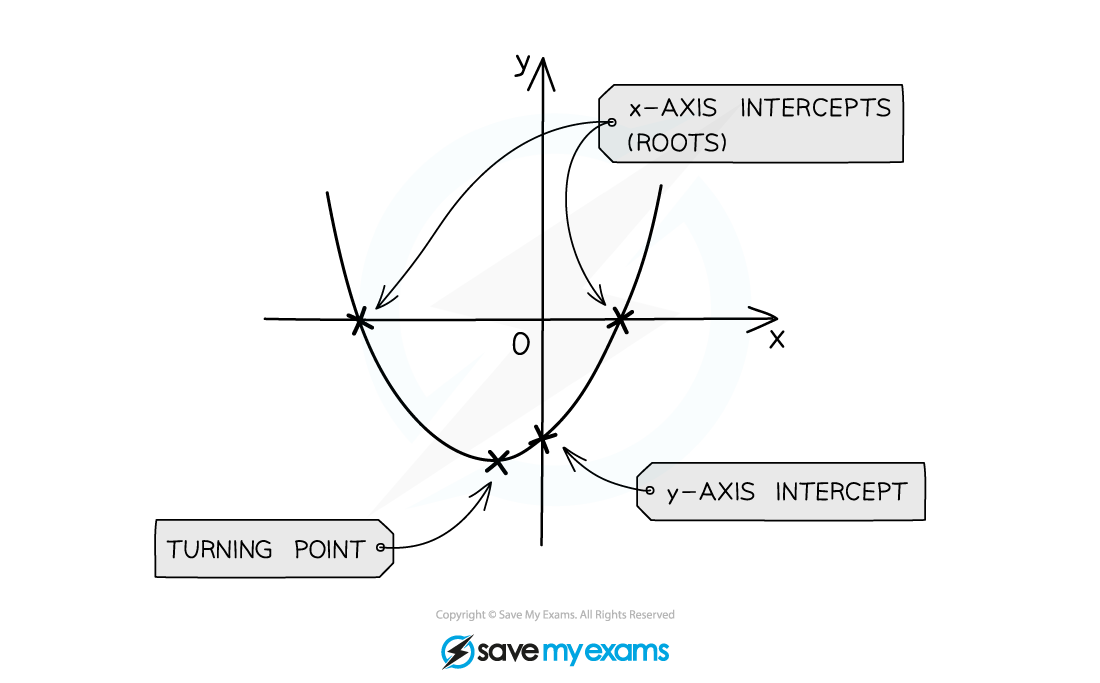
The y-intercept is at the point (0, c)
The roots are the solutions to
These are also known as the x-intercepts or zeroes
They can be found by
Factorising
Quadratic formula
Completing the square
Your calculator may also be able to find these for you
There can be 0, 1 or 2 x-intercepts
This is determined by the value of the discriminant
There is an axis of symmetry at
If there are two x-intercepts then the axis of symmetry goes through the midpoint between them
The vertex lies on the axis of symmetry
It can be found by completing the square
The x-coordinate is
The y-coordinate can be found by calculating y when
If a is positive then the vertex is the minimum point
If a is negative then the vertex is the maximum point
What are the equations of a quadratic function?
This is the general form
It clearly shows the y-intercept (0, c)
You can find the axis of symmetry by
This is the factorised form
It clearly shows the roots (p, 0) & (q, 0)
You can find the axis of symmetry by
This is the vertex form (or completed square form)
It clearly shows the vertex (h, k)
The axis of symmetry is therefore
It clearly shows how the function can be transformed from the graph of
Vertical stretch by scale factor a
Translation by vector
How do I find an equation of a quadratic?
If you have the roots x = p and x = q...
Write in factorised form
You will need a third point to find the value of a
If you have the vertex (h, k) then...
Write in vertex form
You will need a second point to find the value of a
If you have three random points (x1, y1), (x2, y2) & (x3, y3) then...
Write in the general form
Substitute the three points into the equation
Form and solve a system of three linear equations to find the values of a, b & c
Examiner Tips and Tricks
Your calculator may be able to find the roots and turning point of a quadratic function
Even on a 'show that' question this can be used to check your answers
Worked Example
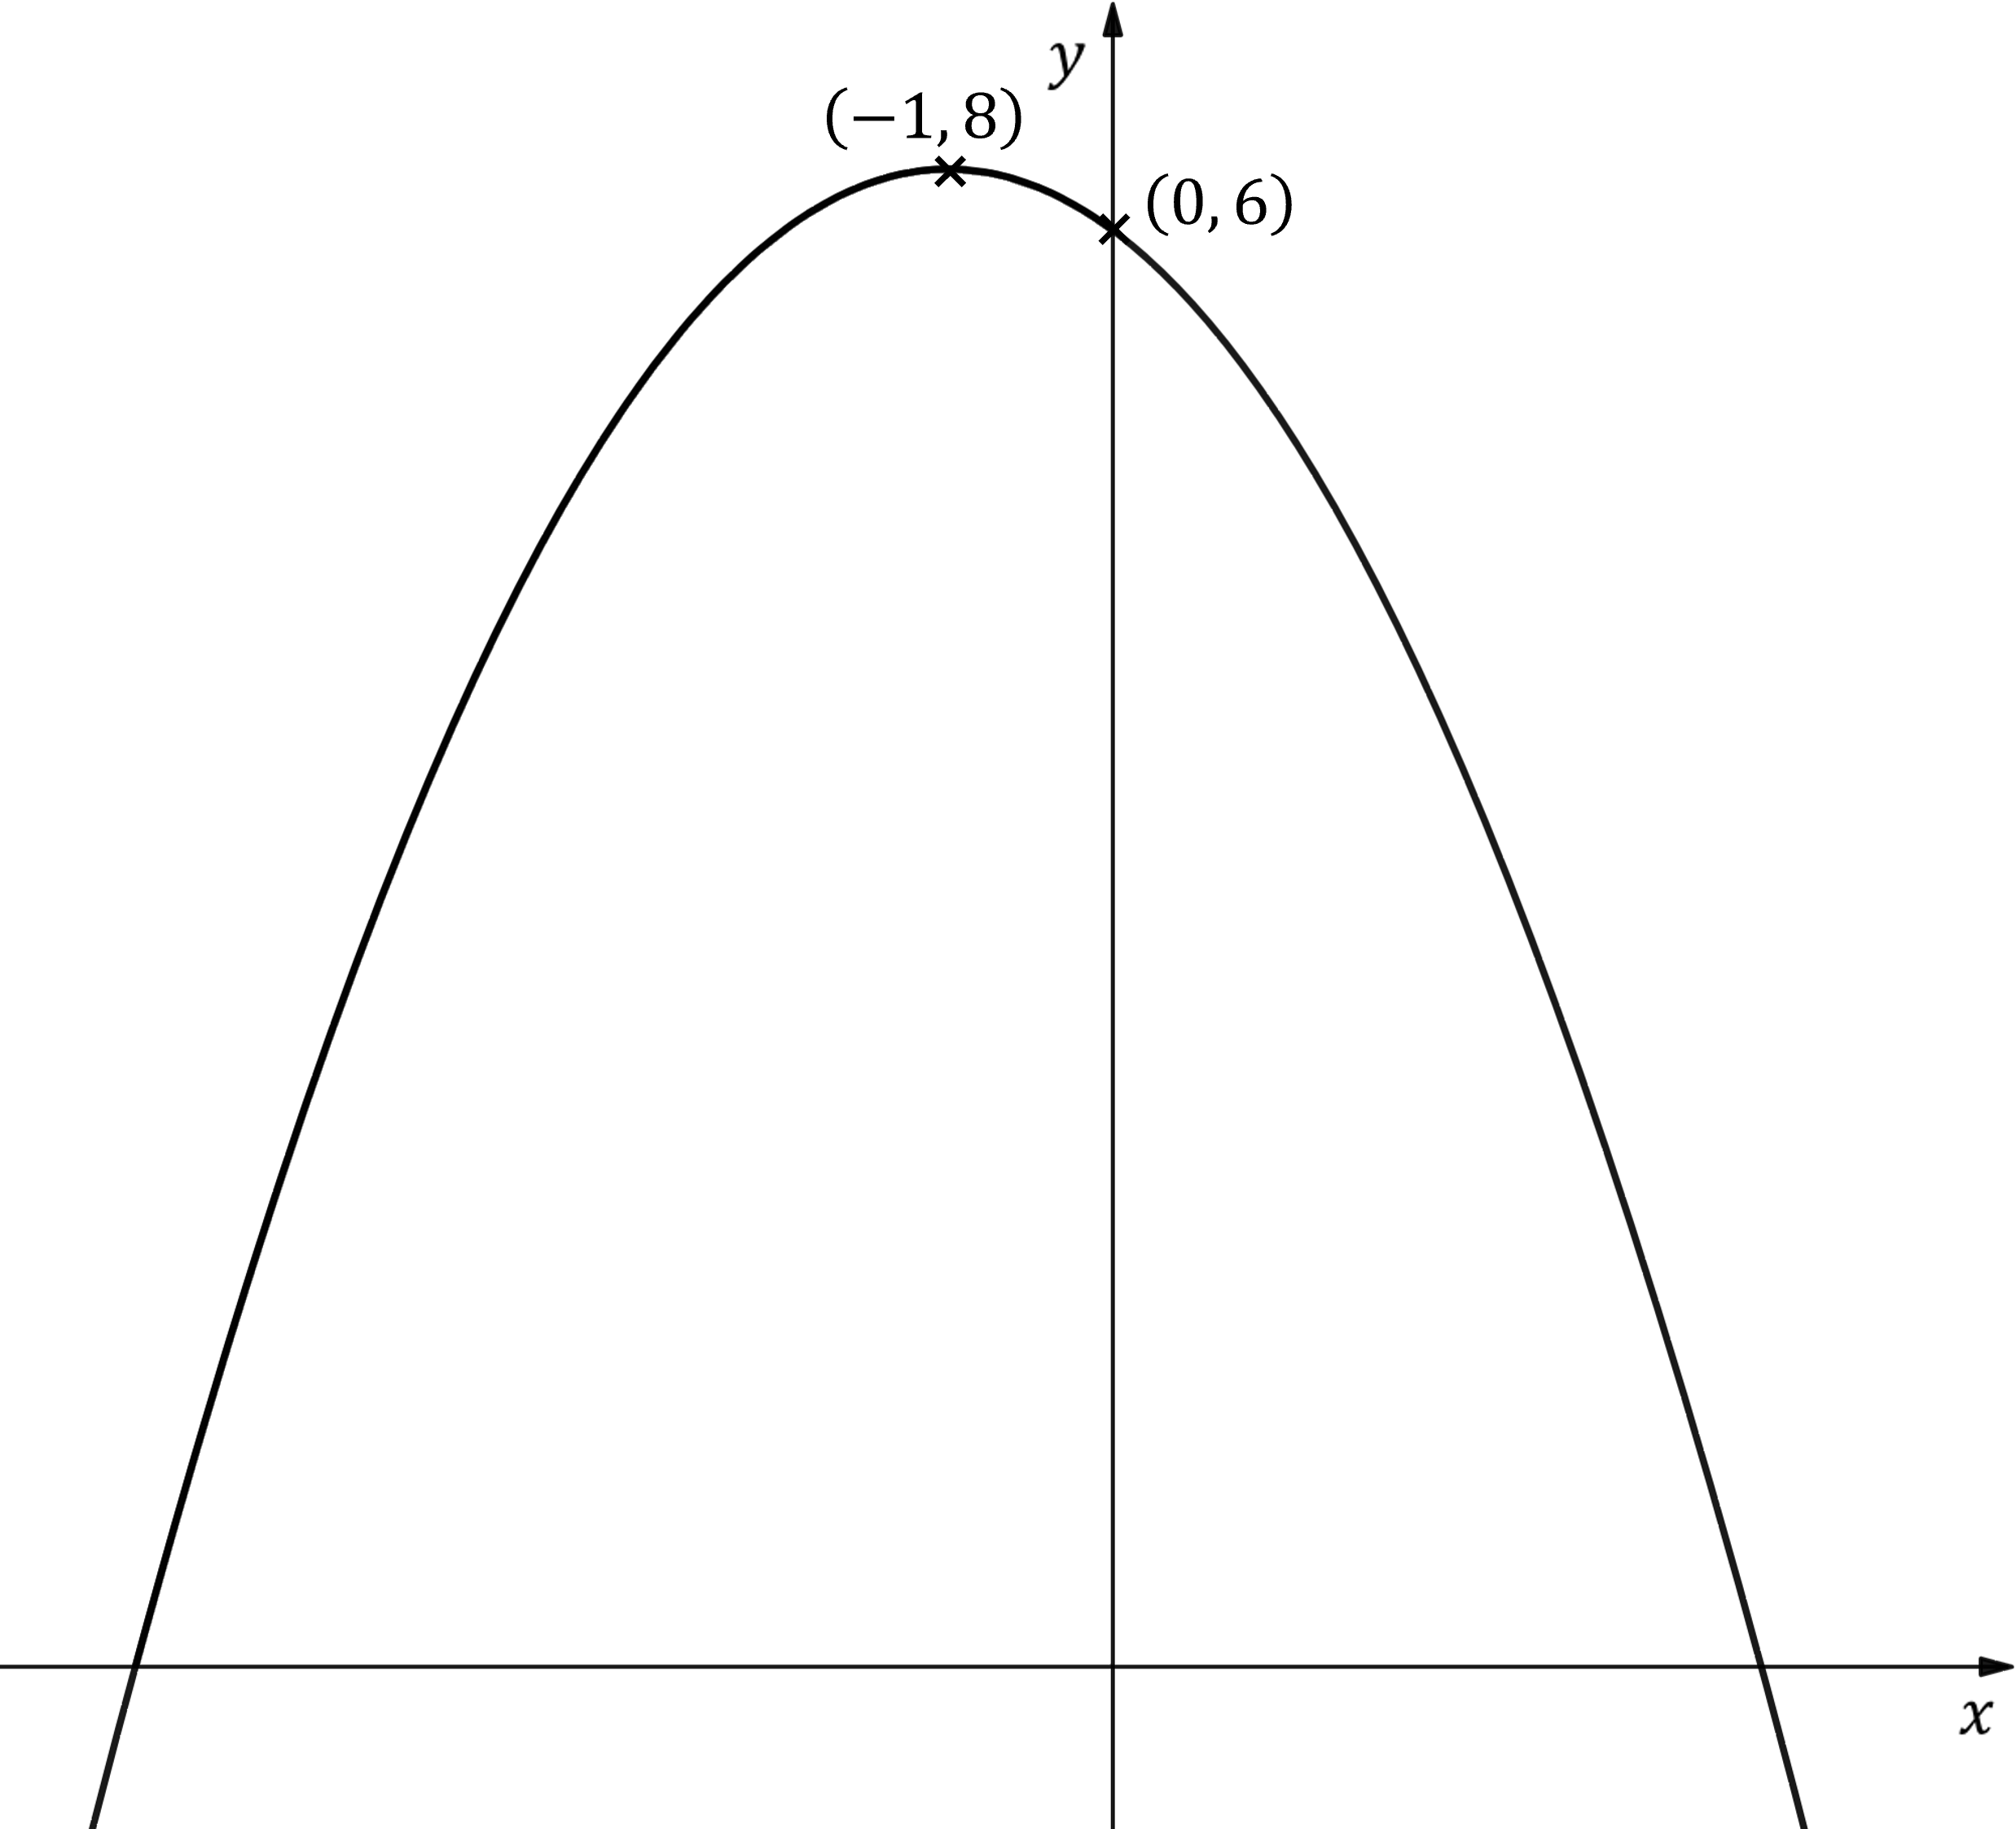
The diagram below shows the graph of , where is a quadratic function.
The vertex and the intercept with the -axis have been labelled.
Find an expression for .
Method 1
Since we know the vertex (turning point), it will be easiest to start with the completed square version of the equation
This is , where the vertex is at
We also know the curve goes through (0, 6)
Put those coordinates into the equation and solve for
Substitute into the expression for
Expand the brackets and rearrange into the form required
Method 2
It is also possible to start with the form
Because the y-intercept is (0, 6) we know that
Goes through means
It also goes through (-1, 8)
Substitute those coordinates into the equation of
Goes through means
We need one more piece of information
You may remember that the turning point lies on the line
If not, then use the fact that the x-coordinate of the turning point satisfies
Turning point at means
Differentiate to find
Then solve to find another equation with and
We now have two simultaneous equations that we can solve to find and
Add [1] and [2] together to eliminate
Substitute into [2] and solve to find
Write final answer in form requested
Cubic Functions & Graphs
What are the key features of cubic graphs?
A cubic graph can be written in the form where
When asked to consider the equation of a cubic and its graph, think about the following
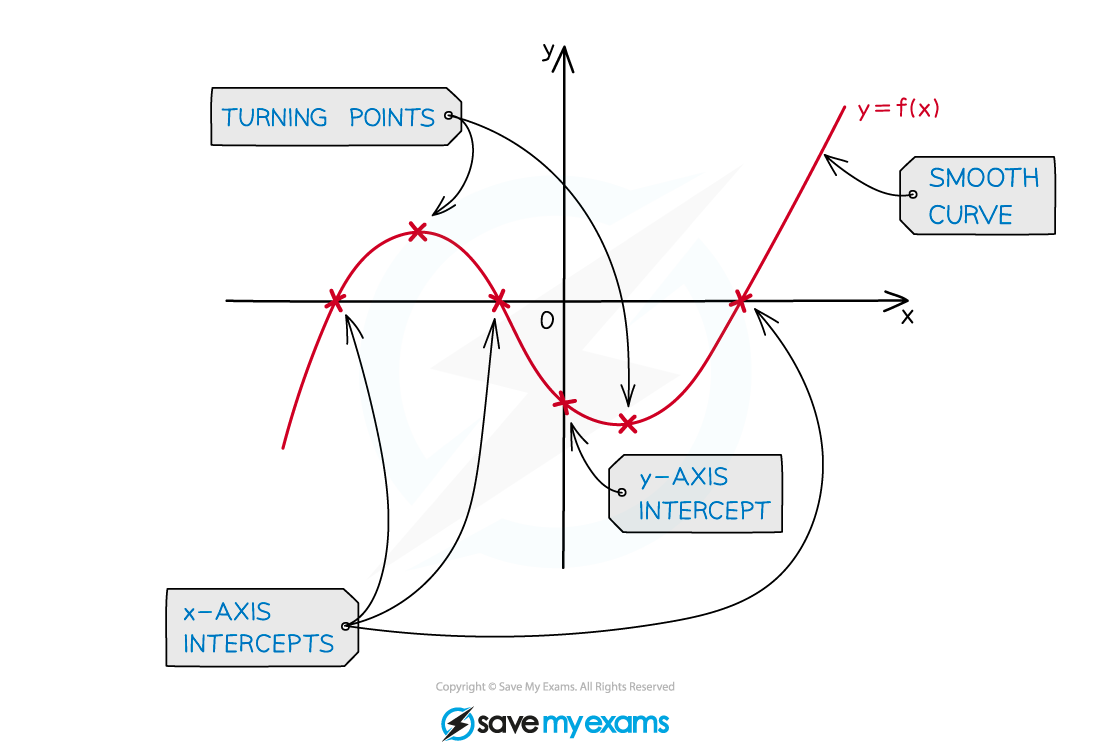
y-axis intercept
This occurs at
x-axis intercepts (roots)
x-coordinates are the solutions to
turning points (maximum and/or minimum)
A cubic can have 0 or 2 turning points
x-coordinates are the solutions to
these are when the derivative of equals 0
The value of affects the shape of the curve
If is positive the ends of the curve will go 'down on the left and up on the right'
If is negative the ends of the curve will go 'up on the left and down on the right'
How do I sketch the graph of a cubic?
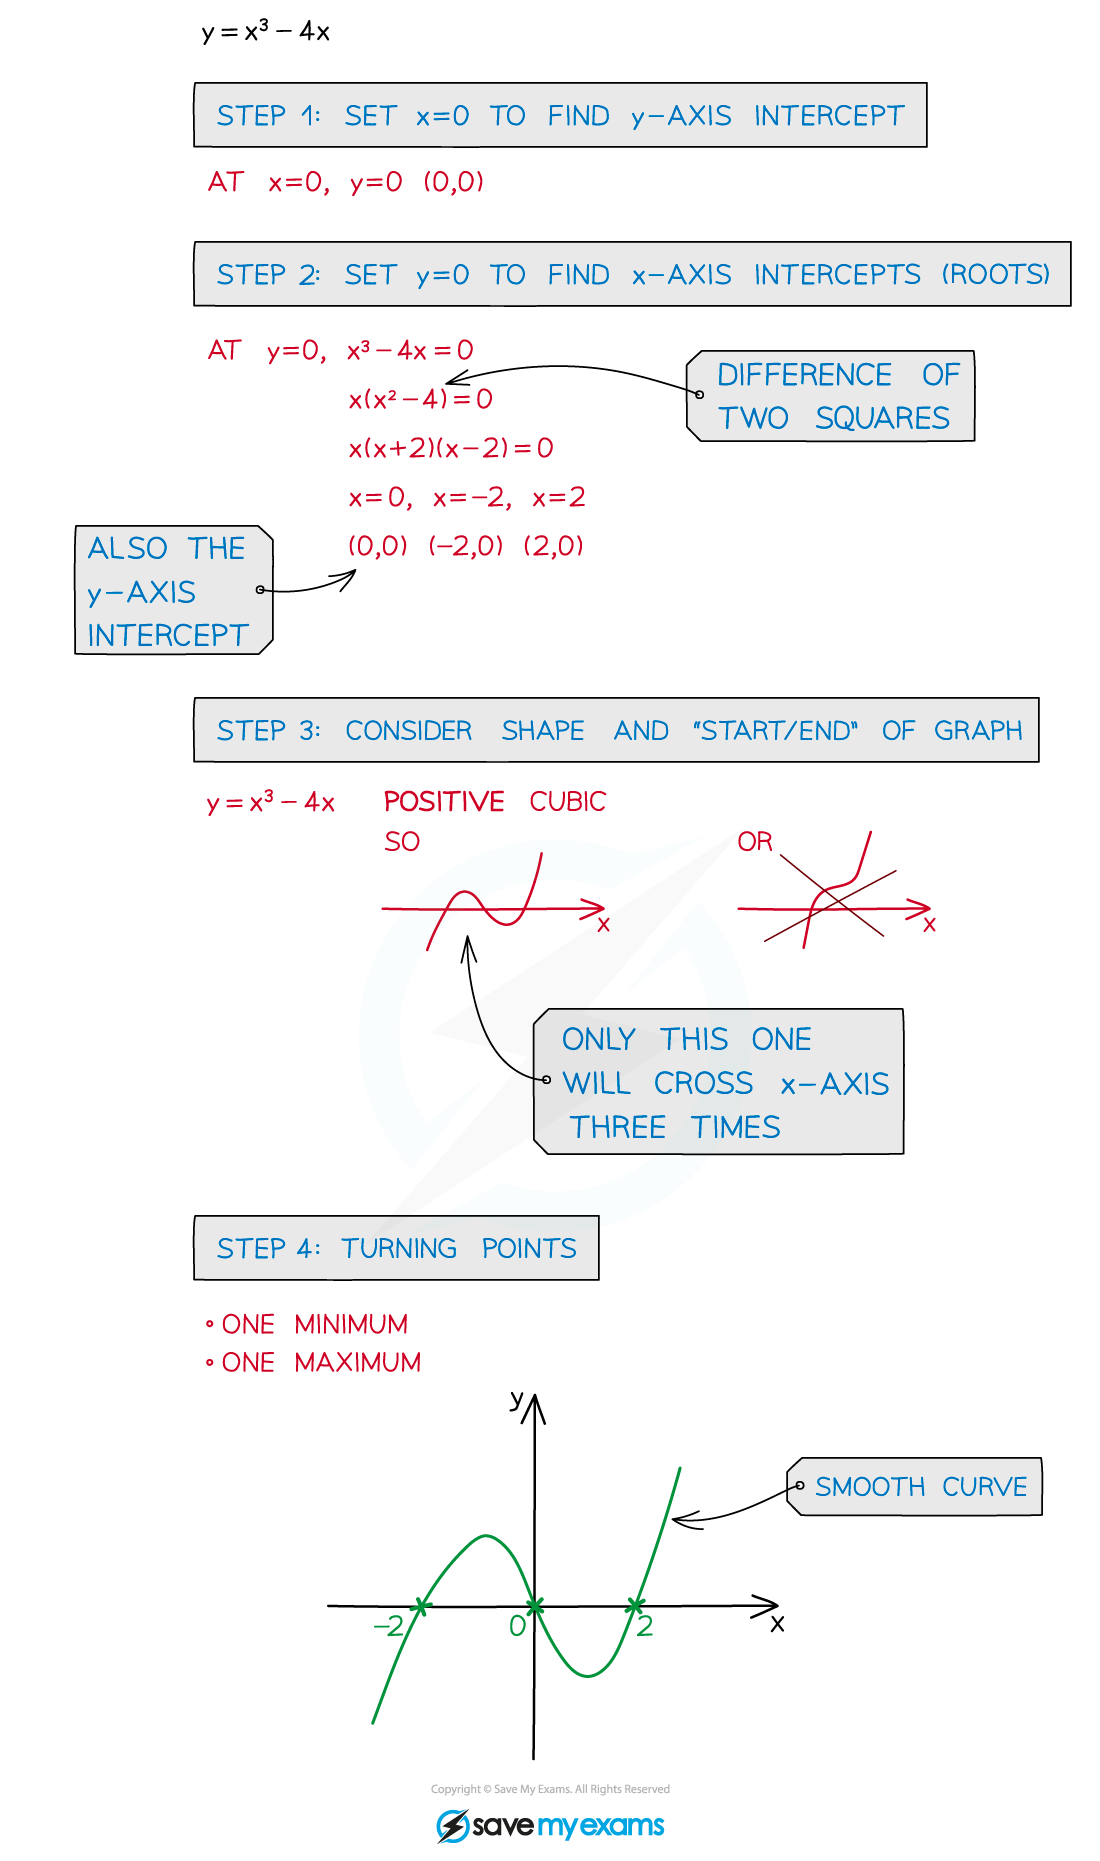
STEP 1
Find the y-axis intercept by setting x = 0STEP 2
Find the x-axis intercepts (roots) by setting y = 0This may require factorising the cubic
STEP 3
Consider the shape and “start”/”end” of the grapha positive cubic graph starts in third quadrant (“bottom left”) and ends in first quadrant (“top right”)
a negative cubic graph starts in second quadrant (“top left”) and ends in fourth quadrant (“bottom right”)
STEP 4
Consider where any turning points should goDifferentiate the equation of the curve and set equal to zero
STEP 5
Draw with a smooth curve (this takes practice!)
Worked Example
Consider the function , where and are constants.
The graph of has two turning points, the -coordinates of which are and .
(a) Find the values of and .
The turning points occur when
Start by differentiating to find
That is equal to 0 when and when
Substitute those values in to find two equations in and
Those are simultaneous equations in and
Subtract the first from the second to eliminate and find
Then substitute that value into either equation to find
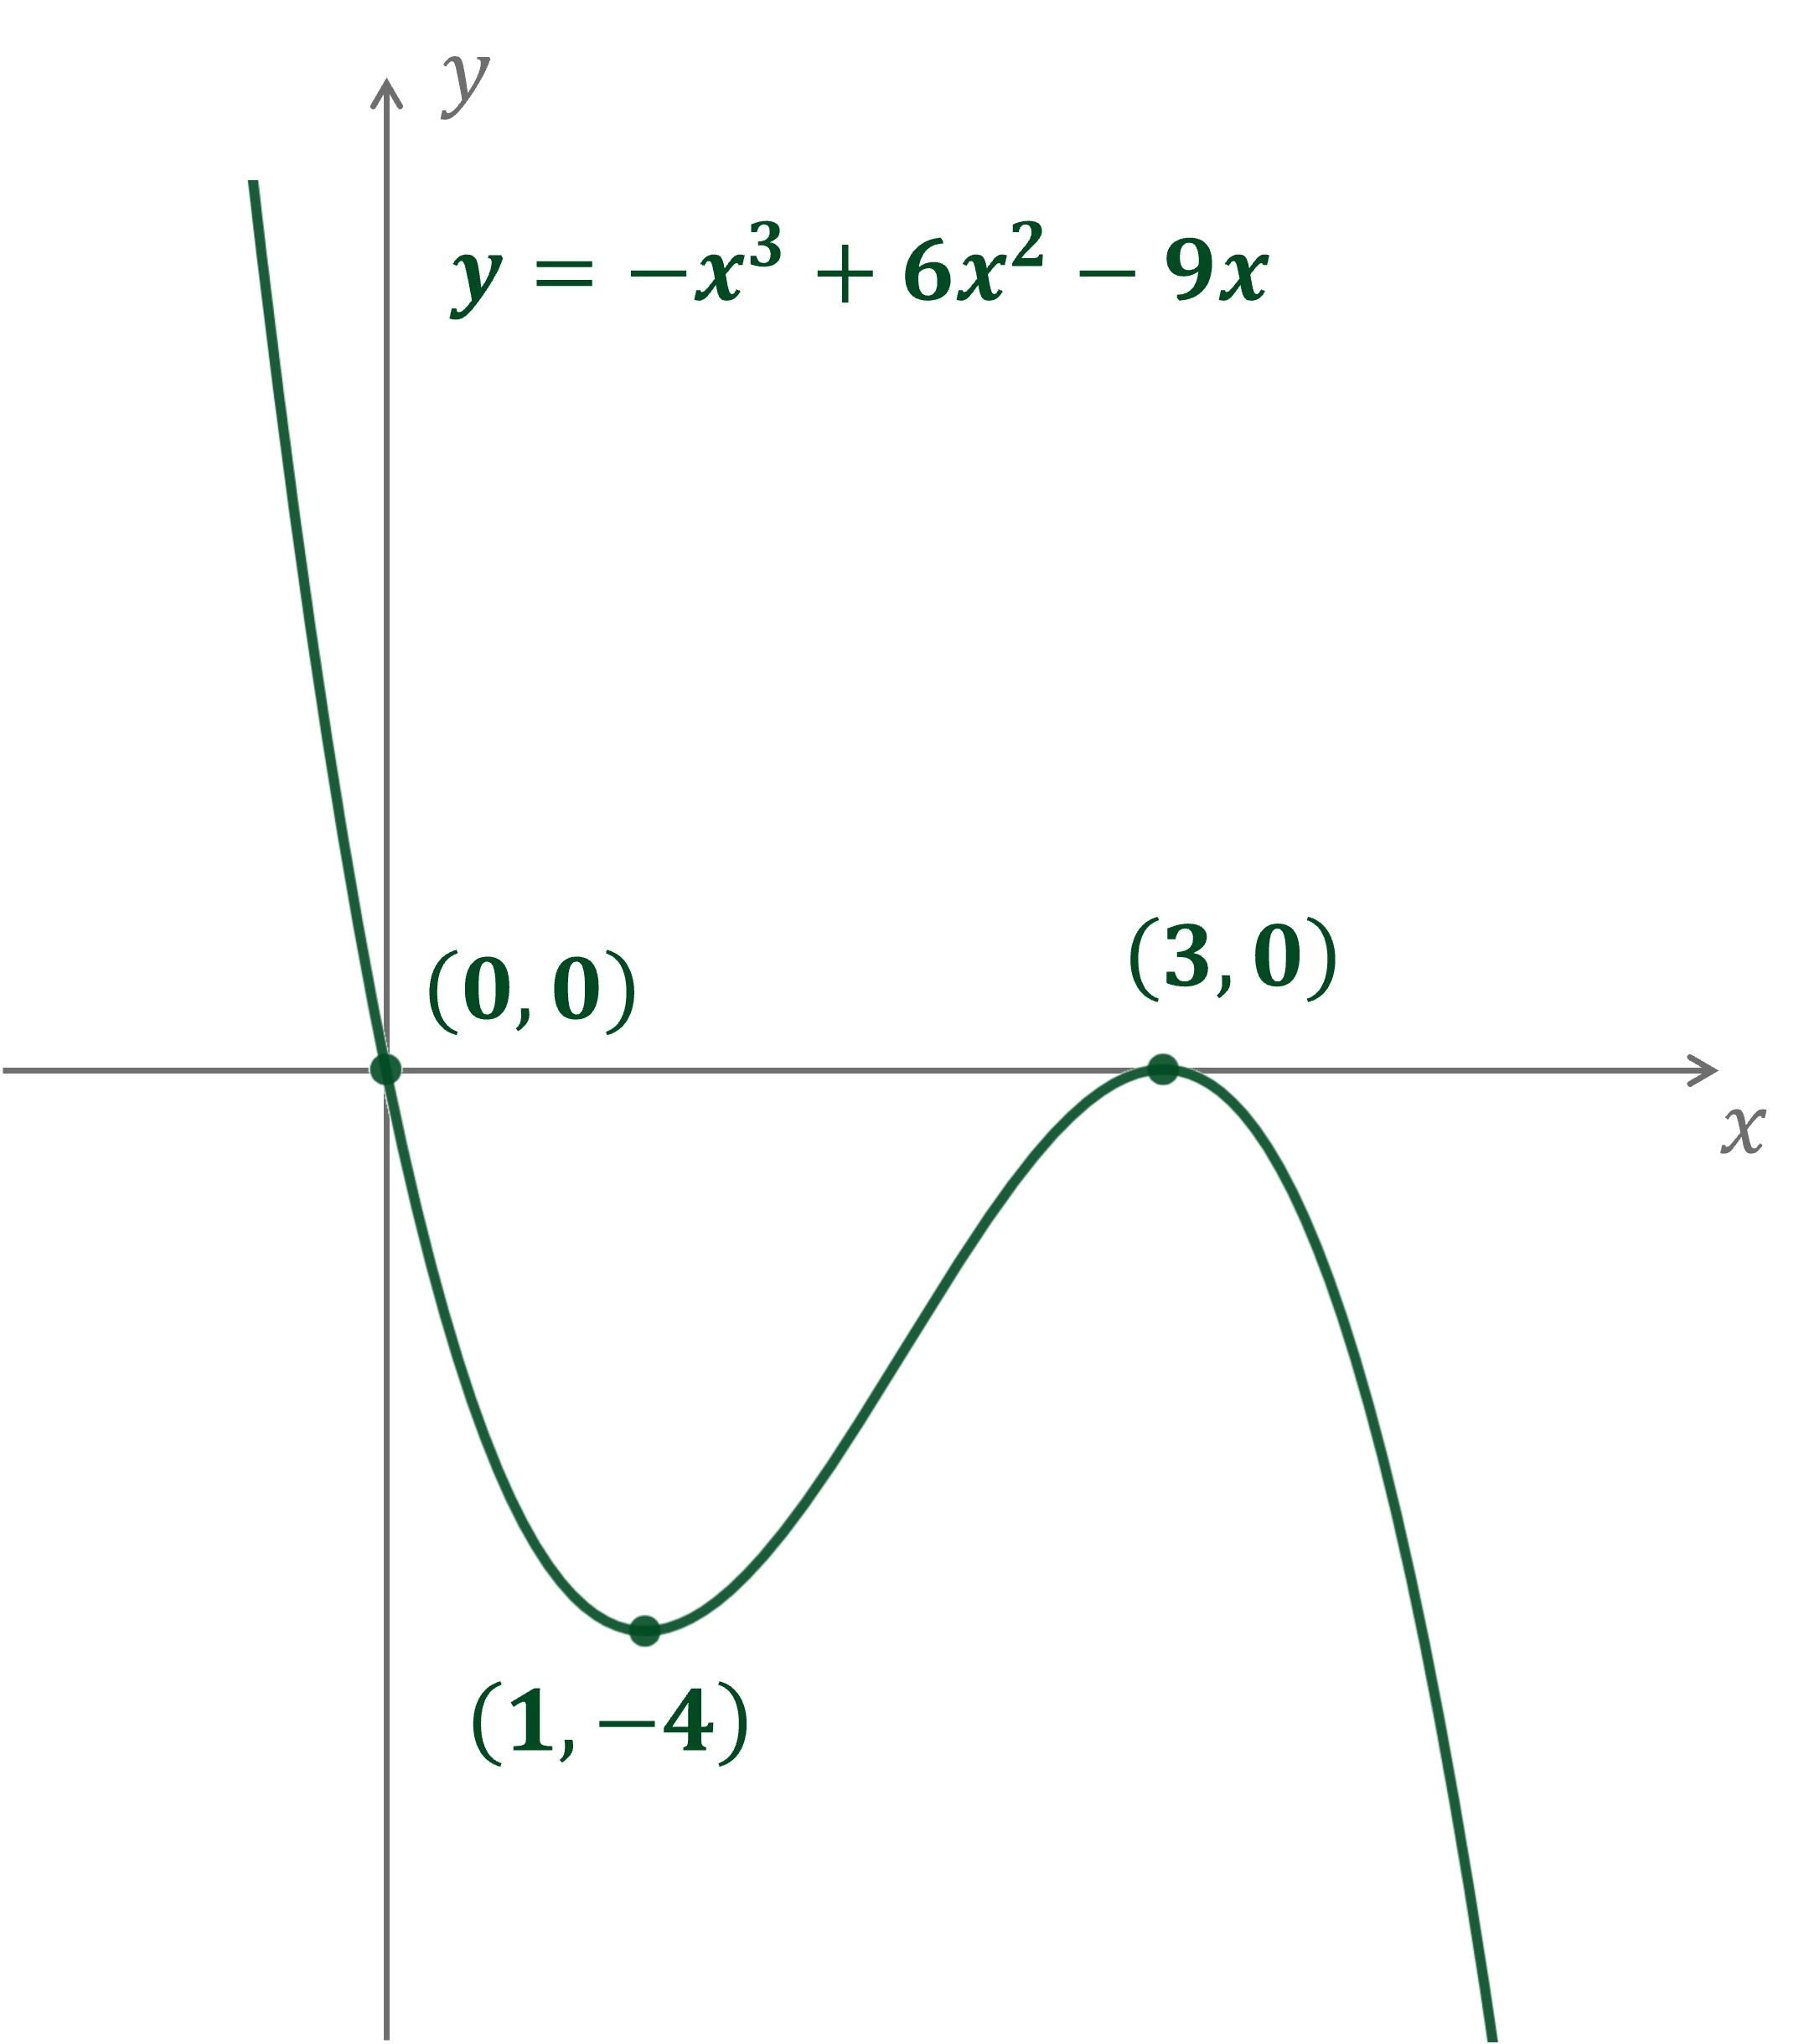
(b) Sketch the graph of .
There is no constant term in , so the y-intercept will be 0
Substitute the x-coordinates of the turning points into to find the corresponding y-coordinates
So the turning points are at and
Find the x-intercepts by solving
So the x-intercepts are and
Note that the first is also the y-intercept. and the second is also a turning point
Finally consider the shape of the curve
It's a 'negative cubic', so it's going to be 'up on the left and down on the right'
Draw a smooth curve incorporating all these features
Label the turning points and intercepts

Unlock more, it's free!
Join the 100,000+ Students that ❤️ Save My Exams
the (exam) results speak for themselves:

Was this revision note helpful?
Build on this topic