Graphs of Inequalities (Edexcel IGCSE Further Pure Maths): Revision Note
Exam code: 4PM1

Finding Regions using Inequalities
How do I draw inequalities on a graph?
STEP 1
Draw the line (as if using “=”) for each inequalityUse a solid line for ≤ or ≥
to indicate the line is included
Use a dashed line for < or >
to indicate the line is not included
STEP 2
Decide which side of line is wanted.Below line if "y ≤ ..." or "y < ..."
Above line if "y ≥ ..." or "y > ..."
To the left of the line if "x ≤ ..." or "x < ..."
To the right of the line if "x ≥ ..." or "x > ..."
If unsure, use a point that's not on the line as a test
Substitute its x and y value into the inequality and check if the inequality is satisfied
This will tell you whether or not the inequality holds true on that side of the line
It's helpful to indicate the 'correct side' of each line on your sketch
STEP 3
Choose the region that satisfies all of the inequalitiesThis is the region that is on the correct side of all the lines
The exam question will often ask you to shade and/or label the region
Examiner Tips and Tricks
You can also indicate a region by shading the unwanted bits and leaving the region unshaded
Some students find this easier
The mark scheme awards full marks for either method
Worked Example
On the axes given below show, by shading on your sketch, the region that satisfies the following three inequalities:
Label the region .
First draw the three straight lines, , and
You may wish to rearrange to the form first:
The line takes a solid line because of the "≥"
The lines and take dotted lines because of the "<"
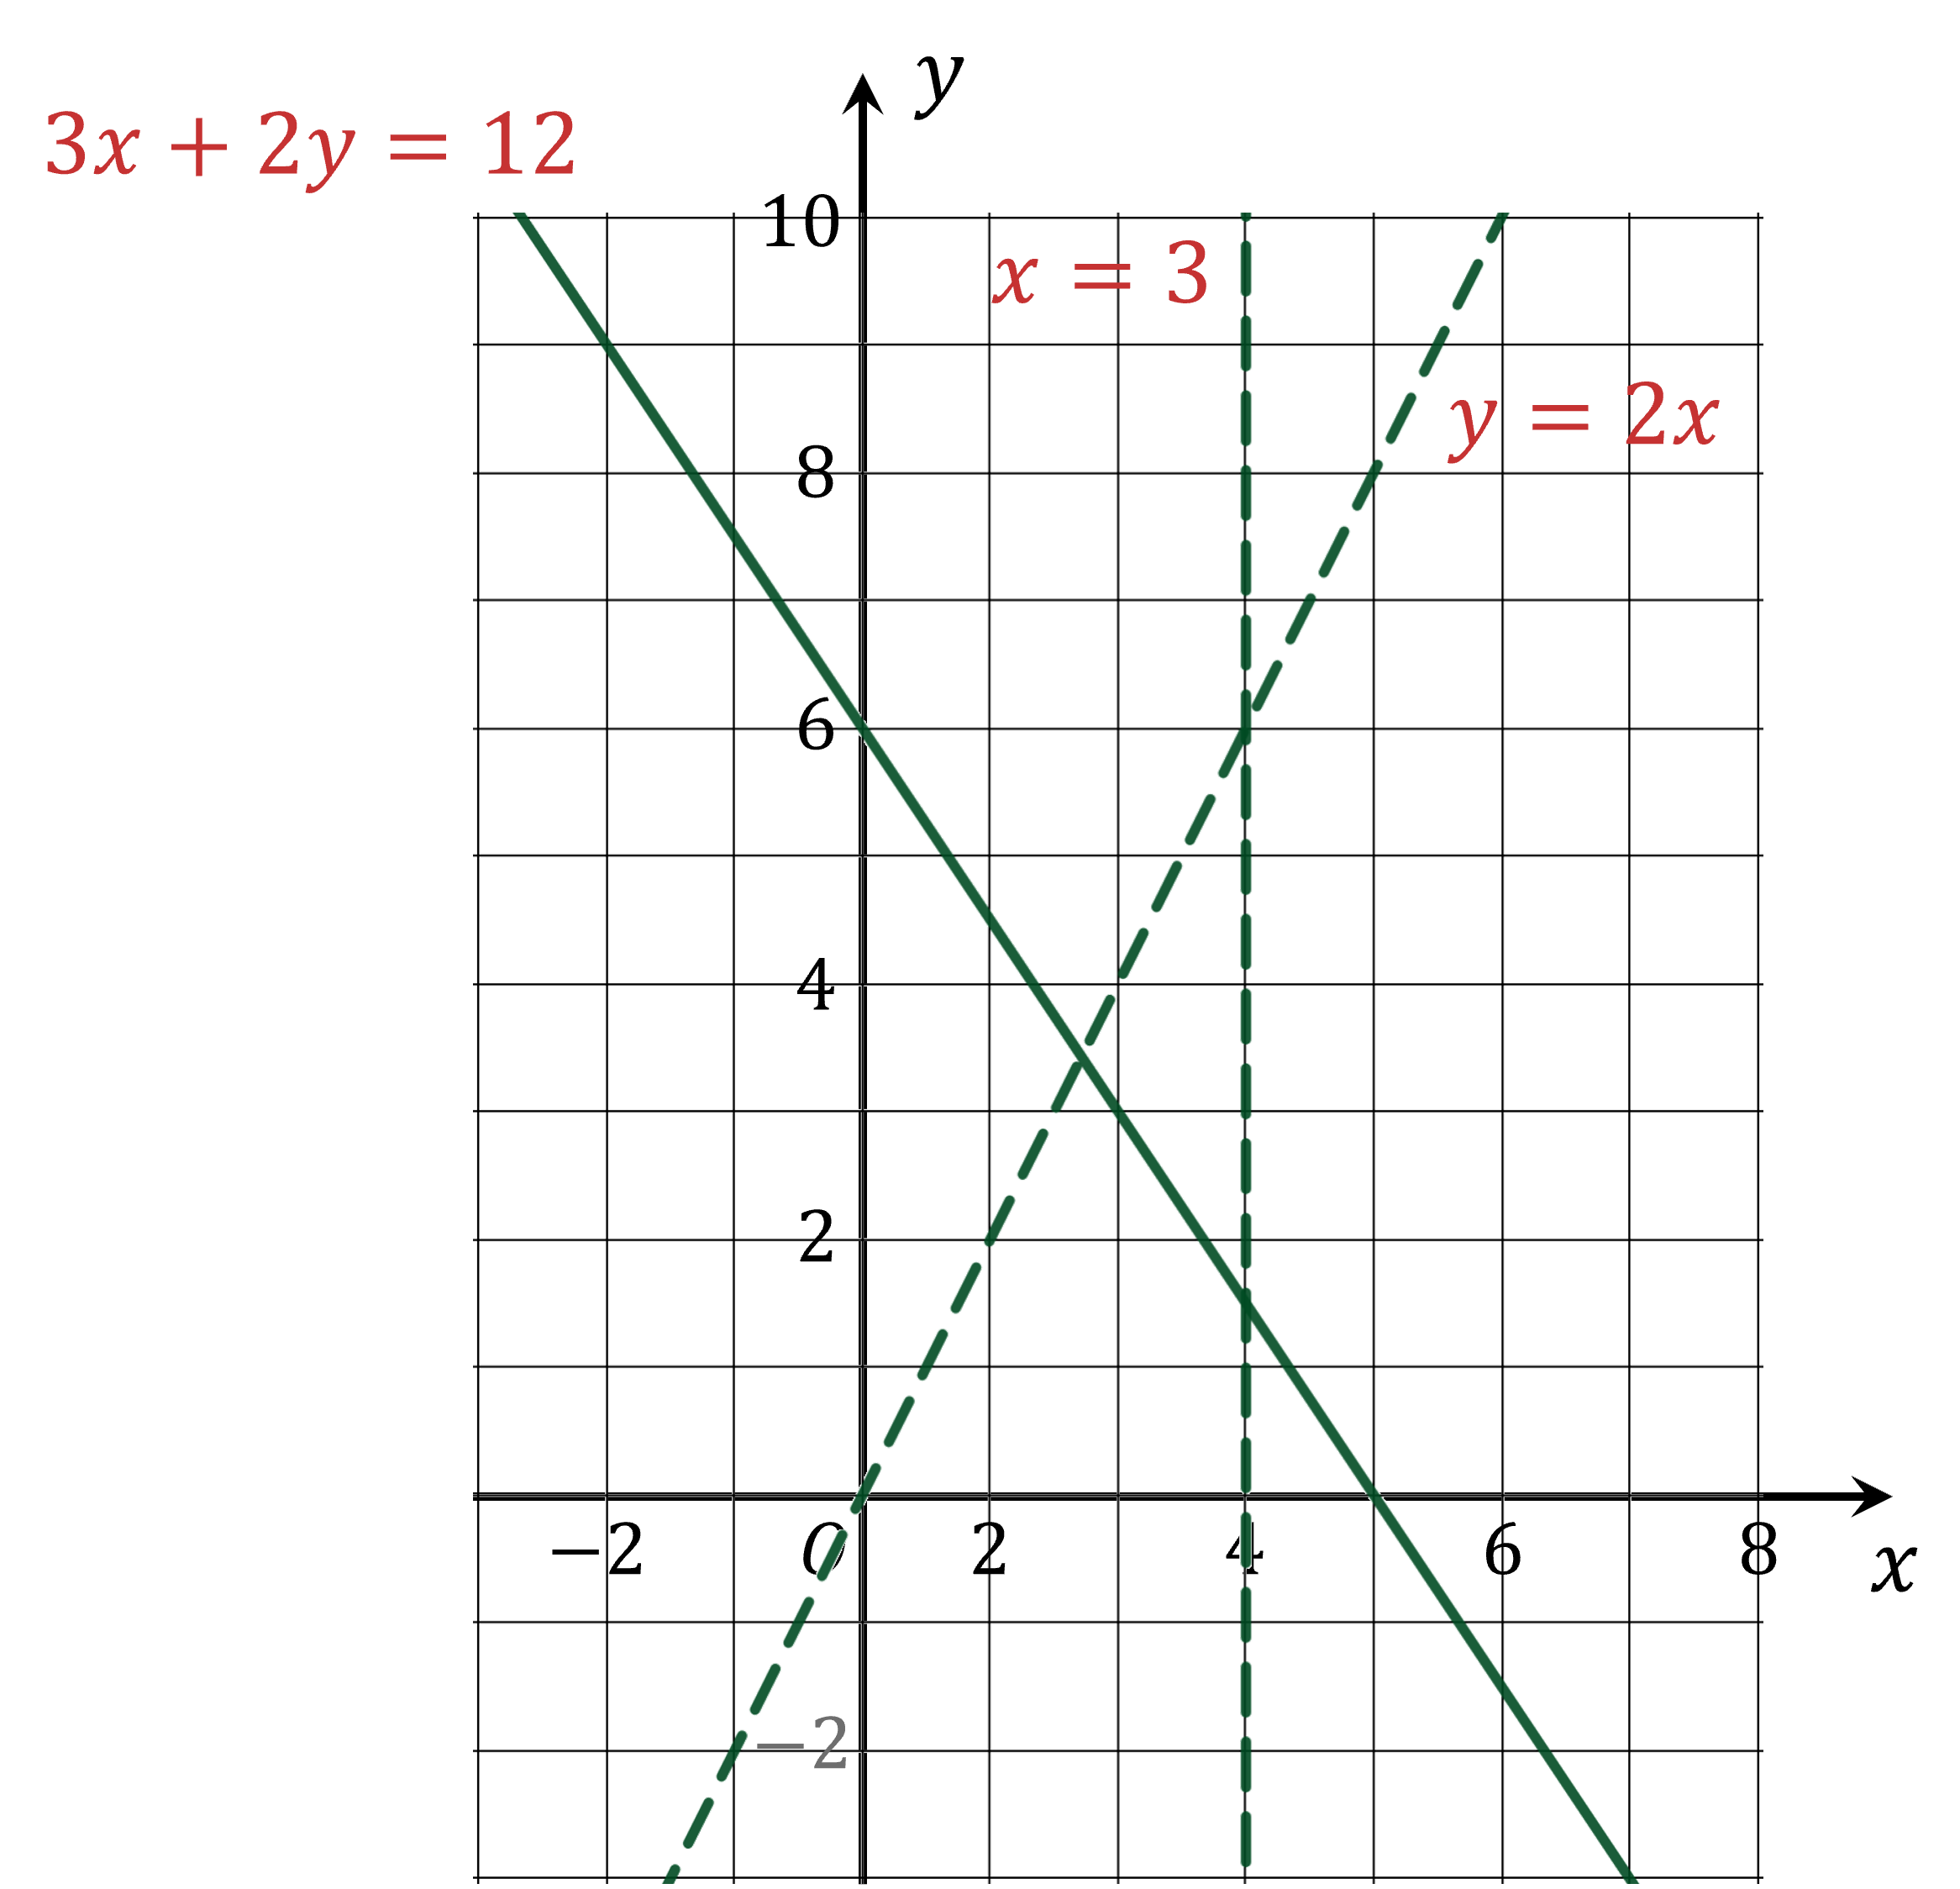
Now we need to determine the wanted and unwanted regions
For (or ), the wanted region is above the line
We can check this with the point (0, 0)
is false, so (0, 0) does not lie in the wanted region for
For , the wanted region is below the line
If unsure, check with another point, for example (1, 0)
is true, so (1, 0) lies in the wanted region for
For , the wanted region is to the left of
(If unsure, you could check with a point)
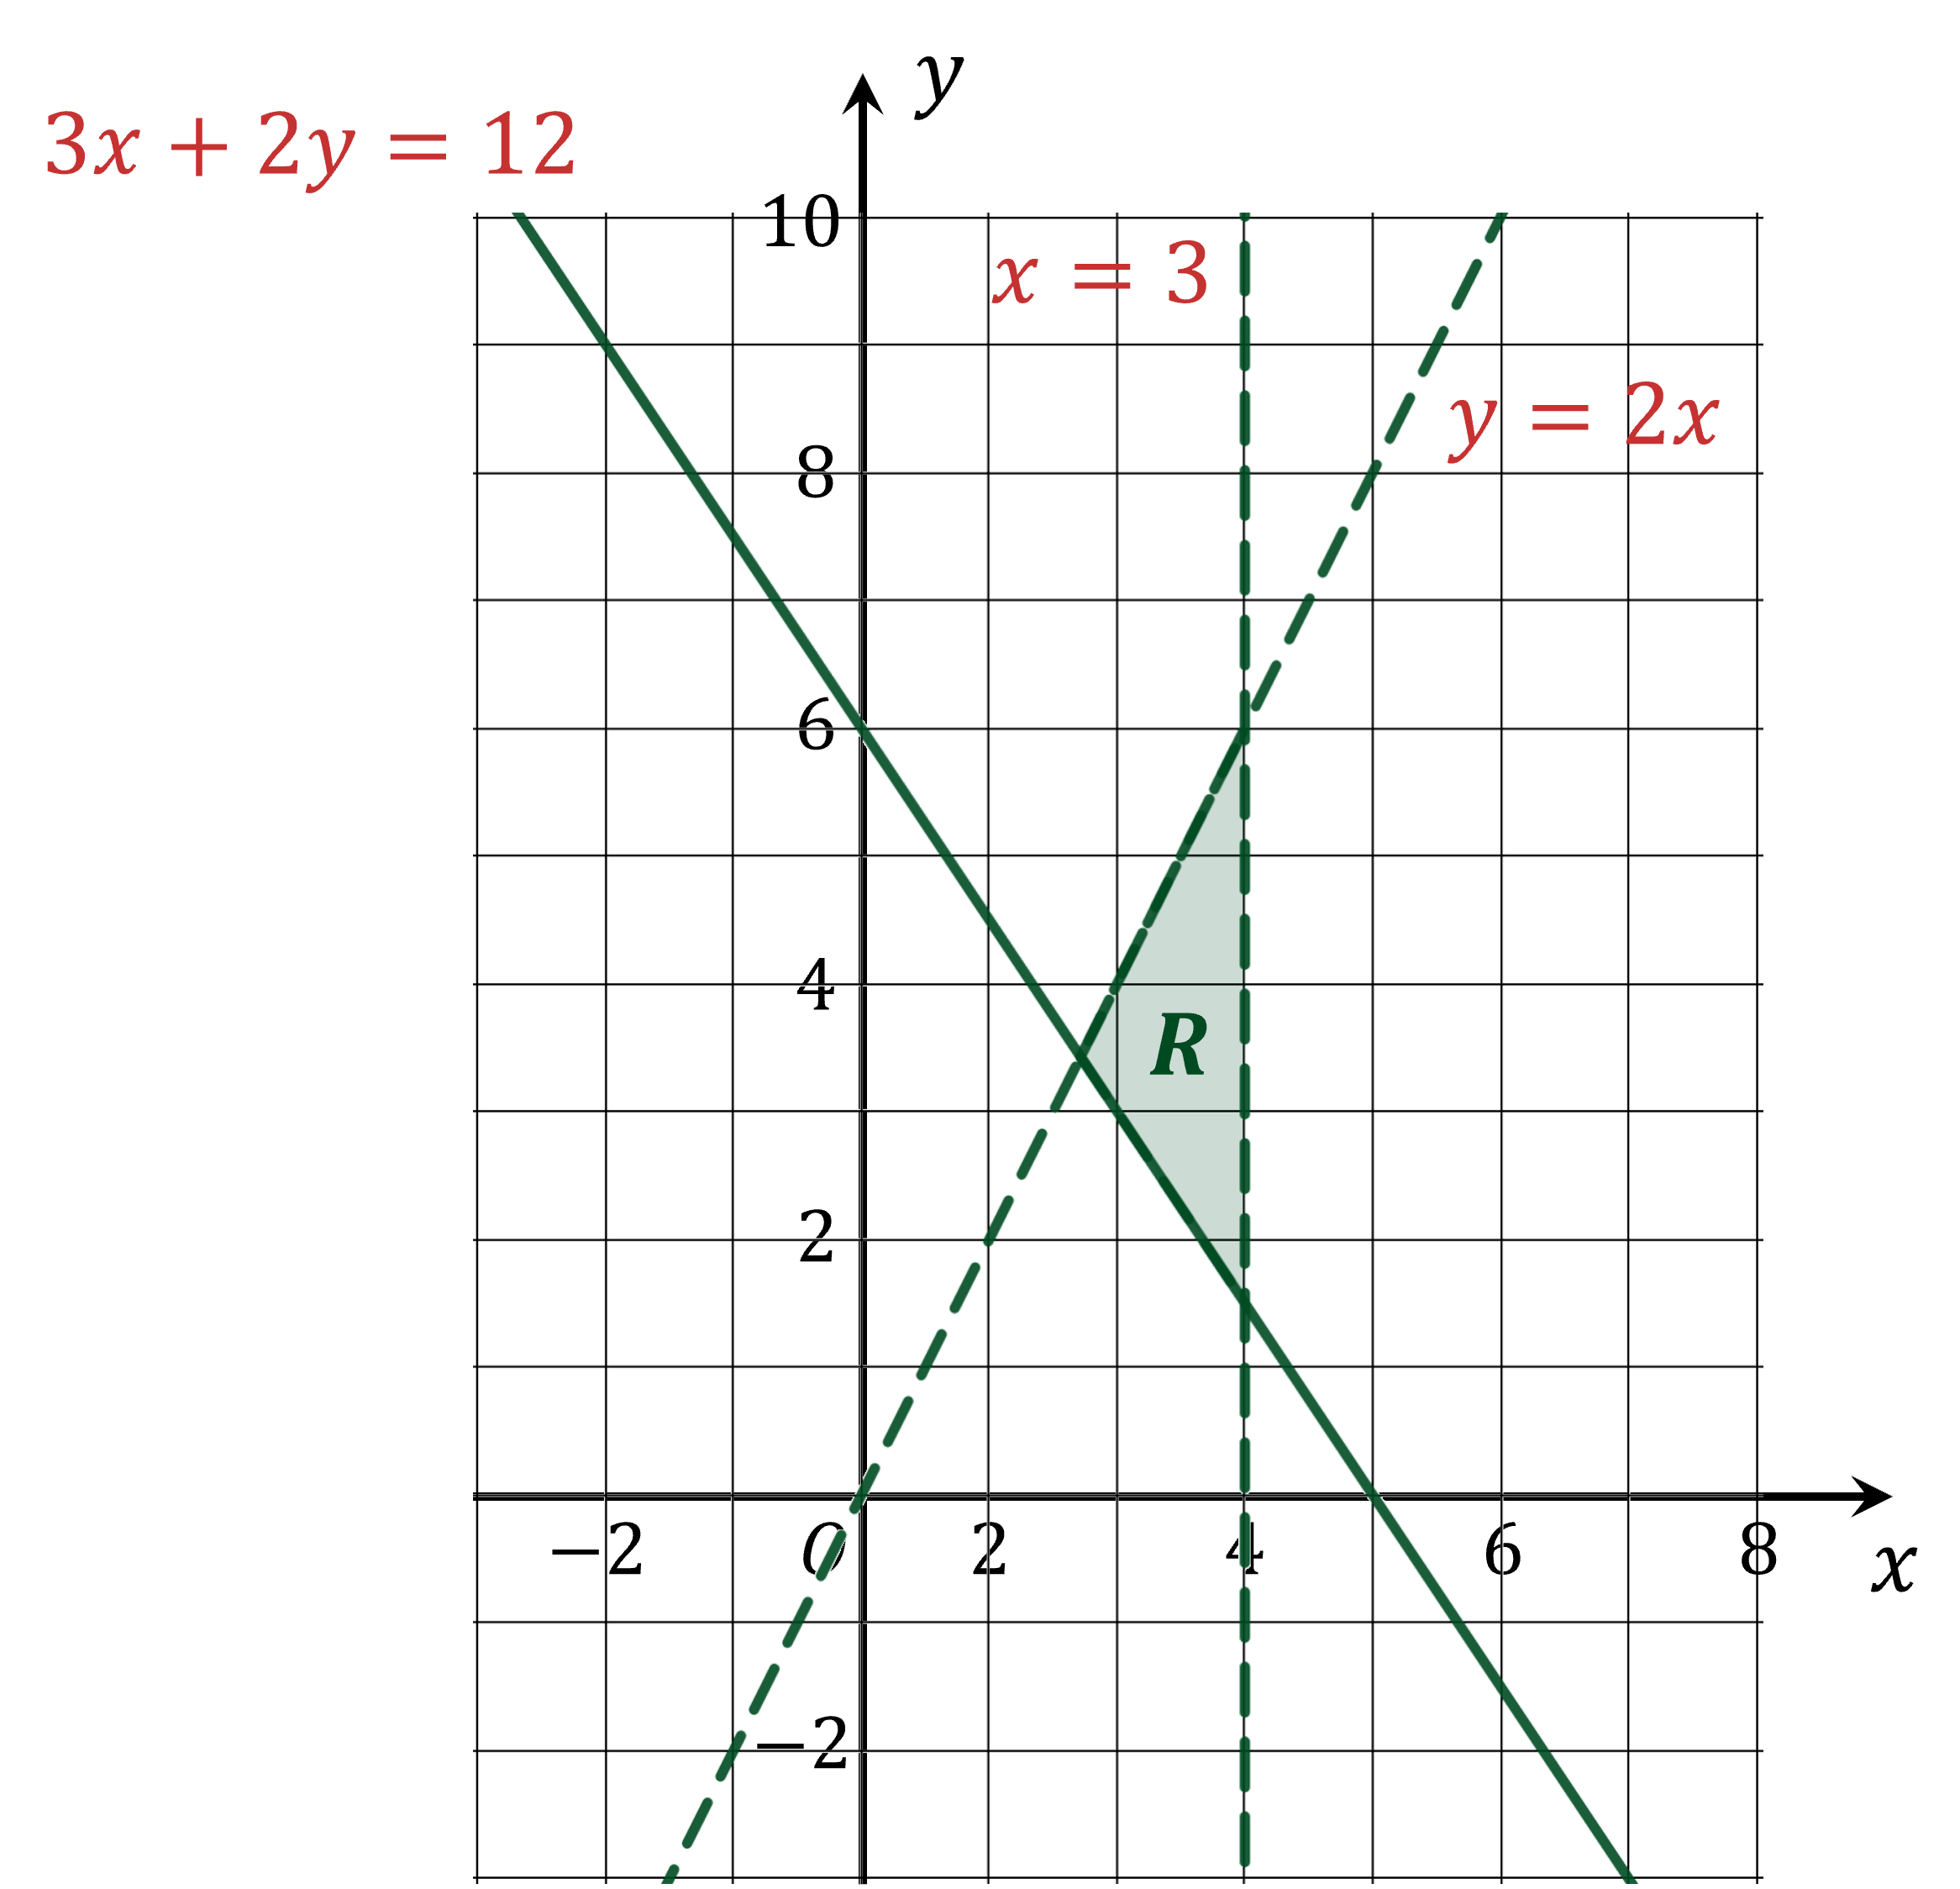
Finally, shade the region that satisfies all three inequalities on the graph
Don't forget to label the region R
Interpreting Graphical Inequalities
How do I determine the inequalities if given a region on a graph?
STEP 1
Write down the equation of each line on the graphSTEP 2
Remember that lines are drawn with:A solid line for ≤ or ≥ (to indicate line included in region)
A dashed line for < or > (to indicate line not included)
STEP 3
Replace = sign with:≤ or < if shading below line
≥ or > if shading above line
Use a point to test if not sure
How do I find optimal solutions from a region on an inequalities graph?
A question may ask you to optimise a function for points in the region
For example, "For all points in the region with coordinates , . Find the greatest value of ."
In these questions the inequalities will usually all be ≤ or ≥
This means all the points on the lines are included in the region
The optimal solution (minimum or maximum) will always occur at a point where two lines intersect
Substitute the coordinates of the intersection points into the function
Choose the point which gives the maximum or minimum value, as required
If the question asks for integer solutions
Check that the optimal intersection point coordinates are both integers
If they are not, the solution will occur at the point with integer coordinates nearest the optimal intersection
Worked Example
(a) Write down the three inequalities that define the shaded region in the diagram below.
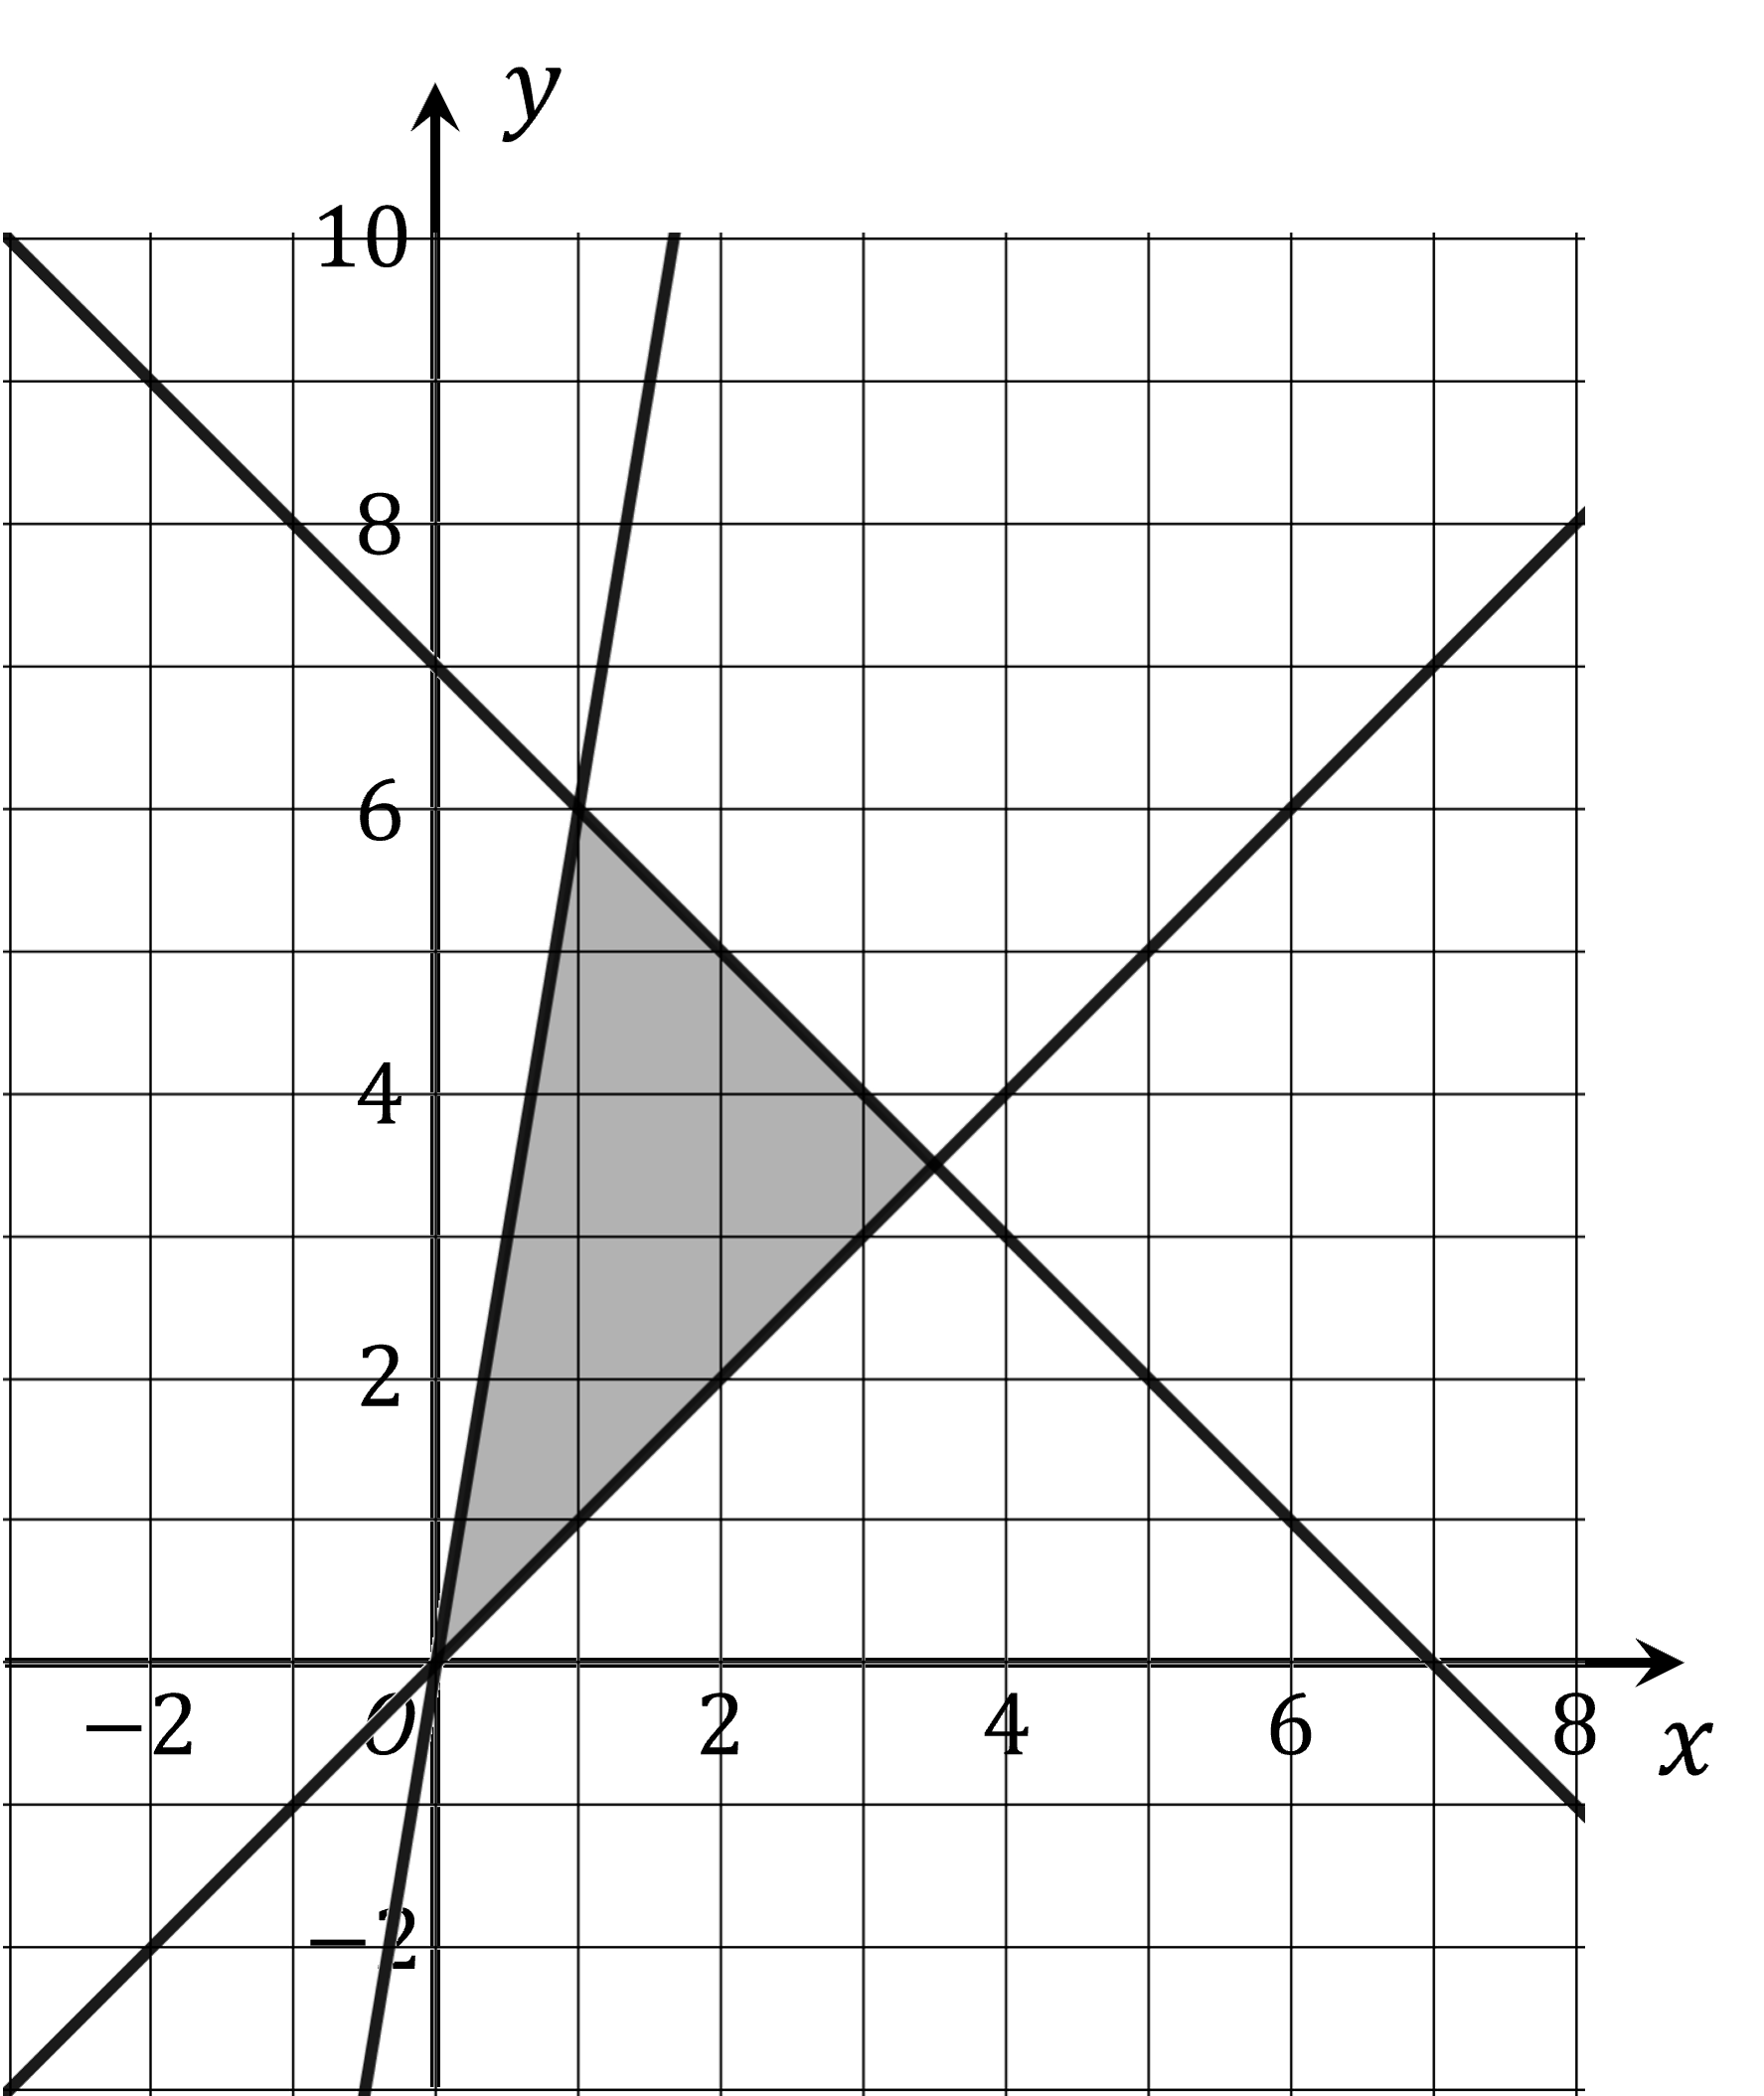
Start by determining the equations of the three lines on the graph.
The line through points (0, 0) and (1, 6) has equation
The line through points (0, 0) and (2, 2) has equation
The line through points (0, 7) and (7, 0) has equation
Label the lines on the diagram with these equations
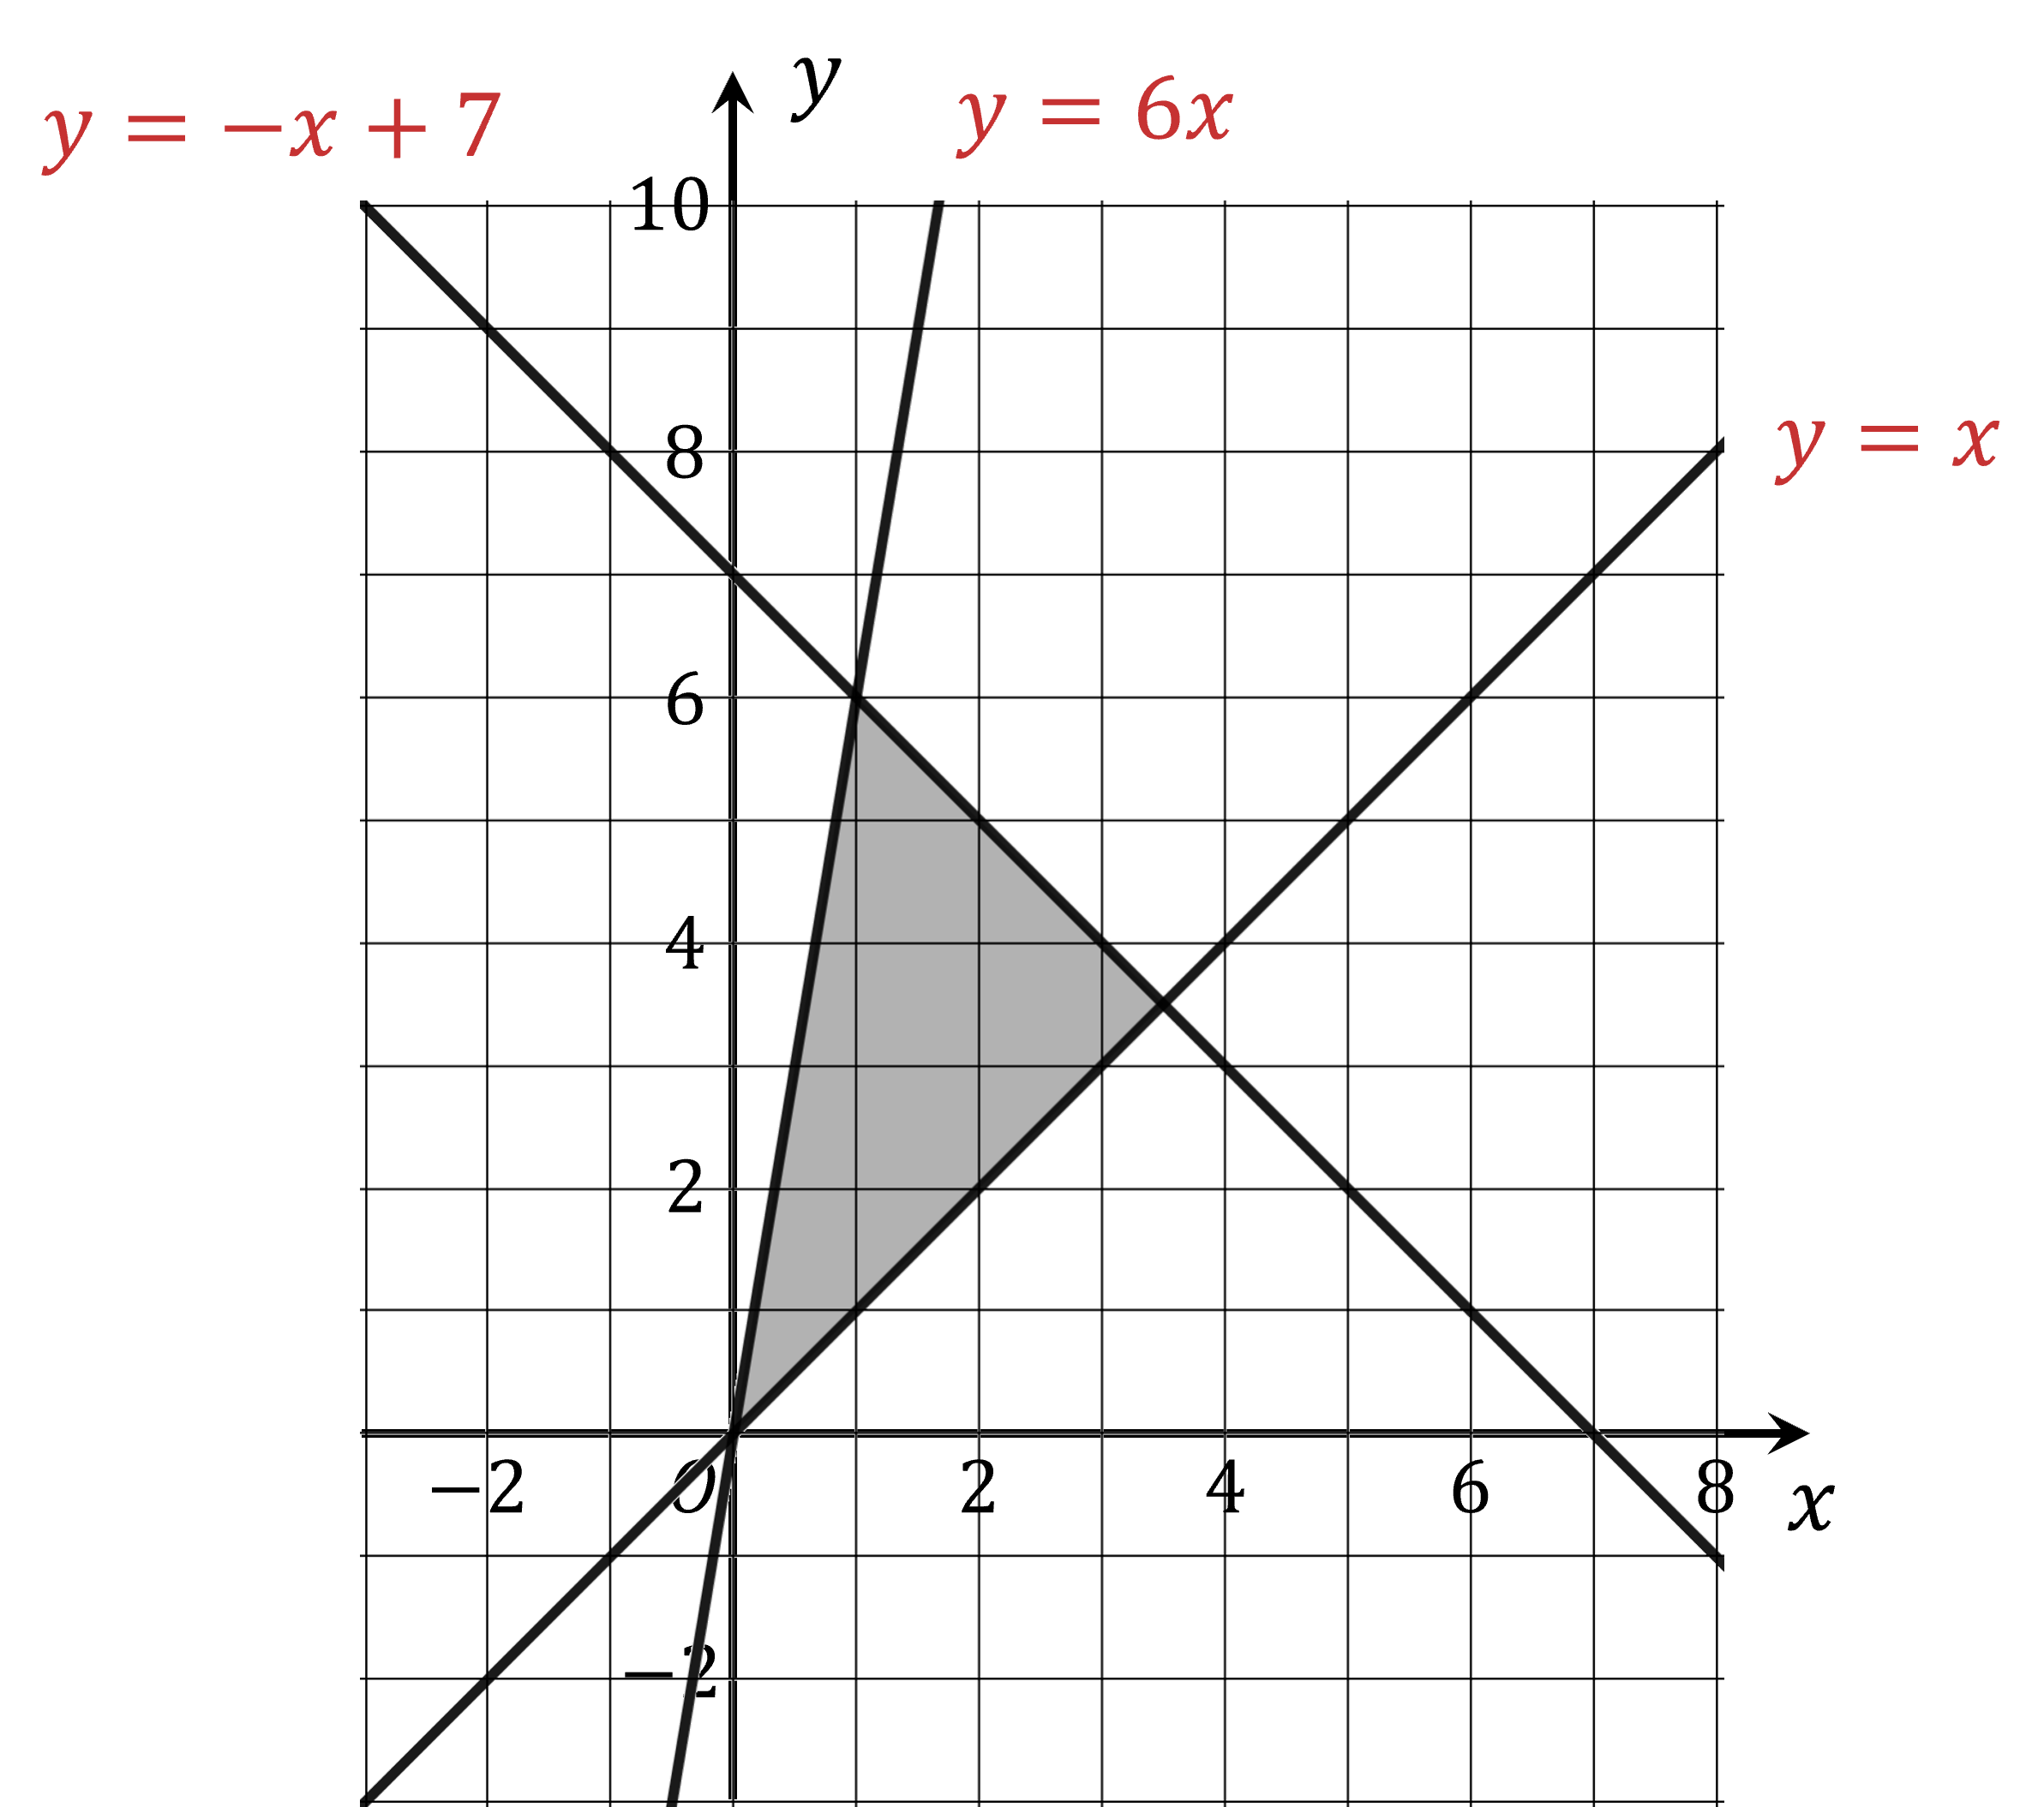
The lines are solid, so all the inequalities will be or
The region is below the lines and , so those will be
The region is above the line , so that will be
Write down these inequalities for the final answer
and
For all points in the shaded region, with coordinates , .
(b) Find the greatest value of .
The greatest (and least) values of will occur at one of the intersections of the lines bordering the region
(These points can be seen on the graph, but it would be worth substituting the coordinates into the equations to make sure)
So we need to find the value of at each of those points
For point (0, 0):
For point (1, 6):
For point (3.5, 3.5):
The greatest value is

Unlock more, it's free!
Join the 100,000+ Students that ❤️ Save My Exams
the (exam) results speak for themselves:

Was this revision note helpful?
Build on this topic
