Graphing Functions (Edexcel IGCSE Further Pure Maths): Revision Note
Exam code: 4PM1

Graphing Functions
How do I graph the function y = f(x)?
A point lies on the graph of if
The horizontal axis is used for the domain
these are the x-values
The vertical axis is used for the range
these are the corresponding y-values
Graphing a function can involve any or all of the following skills
creating a table of values
knowing the general shapes and characteristics of different types of graphs
finding axis intercepts
finding turning points (including maxima and minima)
identifying asymptotes
What is the difference between “draw” and “sketch”?
'Sketch' questions will not provide a detailed grid to draw the graph on
A sketch is meant to show key features of a graph
It does not need to be perfectly to scale
It does not need to plot points precisely
When asked to sketch you should:
Show the correct general shape
Label any key points such as the intersections with the axes
Label the axes
Label the graph by giving its function or equation
'Draw' questions will always provide a detailed grid to draw the graph on
A drawing of a graph is meant to be as accurate as possible
When asked to draw you should:
Use a ruler for any straight lines
Draw to scale
Plot any points precisely
Join points with a straight line or smooth curve
Label any key points such as the intersections with the axes
Label the axes
Label the graph by giving its function or equation
Can my calculator help me sketch/draw a graph?
Your calculator may be able to display graphs of functions
If so make sure you are familiar with how this feature works
This can be useful for checking your work
It can also help with identifying
the general shape of a graph
axis intercepts
turning points (including maxima and minima)
But be careful, especially on 'show that' questions
Make sure key parts of an answer are backed up by working
Marks may depend on this
Key Features of Graphs
What are the key features of graphs?
You should be familiar with the following key features and know how to identify them
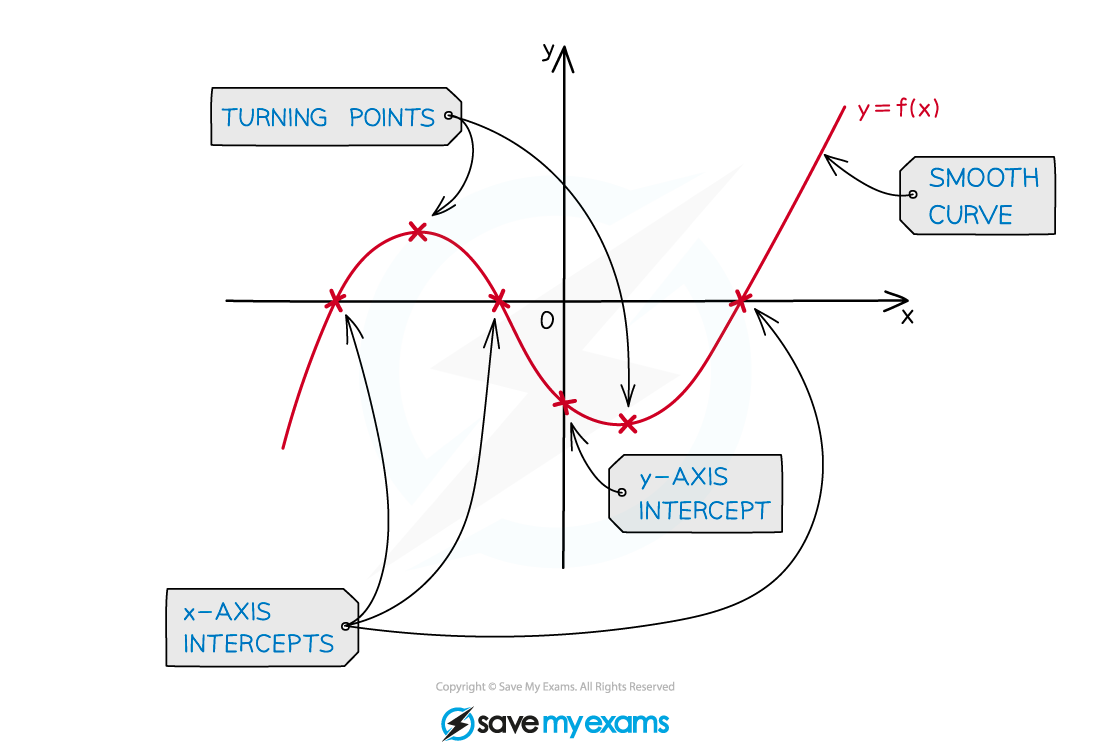
Local minima and maxima
These are points where the graph has a minimum/maximum for a local region
They are the 'peaks' or 'valleys' of a graph
They are not necessarily the minimum or maximum for the whole graph
They are also called turning points
A graph can have multiple local minima or maxima
They occur where the gradient of the graph is equal to zero
So if you are graphing
Turning points will occur where
Intercepts
y-intercepts are where the graph crosses the y-axis
At these points
x-intercepts are where the graph crosses the x-axis
At these points y = 0
These points are also called the roots of the function
Symmetry
Some graphs have lines of symmetry
E.g. a quadratic graph has a vertical line of symmetry through its minimum or maximum point
Asymptotes
These are lines which the graph will get closer to but not cross
These can be horizontal or vertical
Exponential graphs have horizontal asymptotes
Logarithmic graphs and graphs of rational functions have vertical asymptotes
Examiner Tips and Tricks
Don't forget to label the graph, the axes and key features when drawing or sketching a graph
Marks may depend on this
Your calculator may be able to help you with drawing or sketching a graph
But don't forget to show working, especially in a 'show that' question
Sketching a graph can often be useful even if a question doesn't require it
Worked Example
A function is defined by .
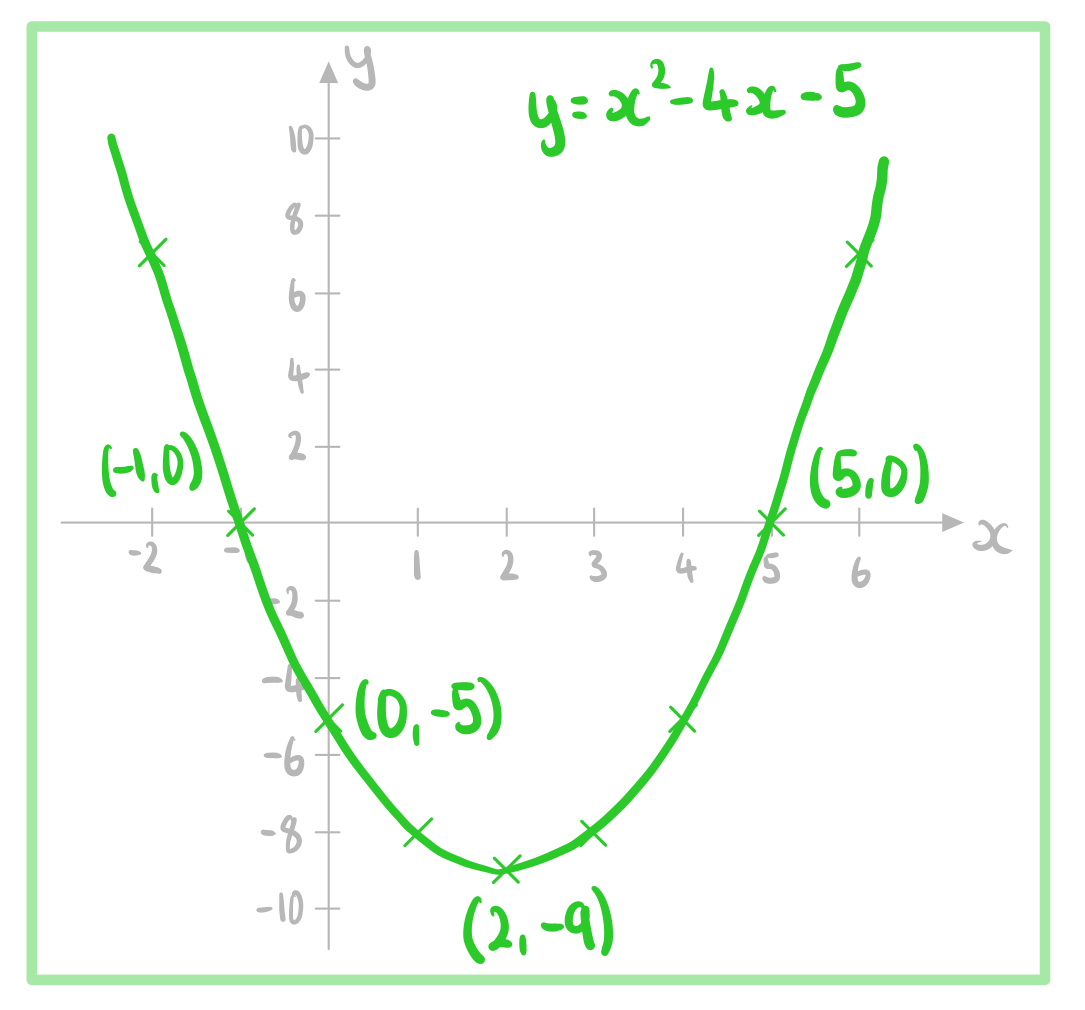
Sketch the graph .
Remember, 'sketch' here means we only need to show the general shape and key features
This is a positive quadratic, so it is going to be a 'u-shaped' parabola
Find the y-intercept by substituting in
So the y-intercept is
The x-intercepts will occur when
So the x-intercepts are and
The turning point will occur when
Substitute into to find the corresponding y-value
So the turning point is
Sketch a graph showing the correct general shape and incorporating all the key points identified above
Label the graph, the axes, and the key features

Unlock more, it's free!
Join the 100,000+ Students that ❤️ Save My Exams
the (exam) results speak for themselves:

Was this revision note helpful?
Build on this topic
