Graphs (Edexcel IGCSE Further Pure Maths): Exam Questions

Exam code: 4PM1

2 hours11 questions
1a
2 marks

Complete the table of values for

y = 2(x2+1)+1

giving your answers to 2 decimal places where appropriate.

x

0

1

2

3

4

5

y

3

9

12.31

1b
2 marks

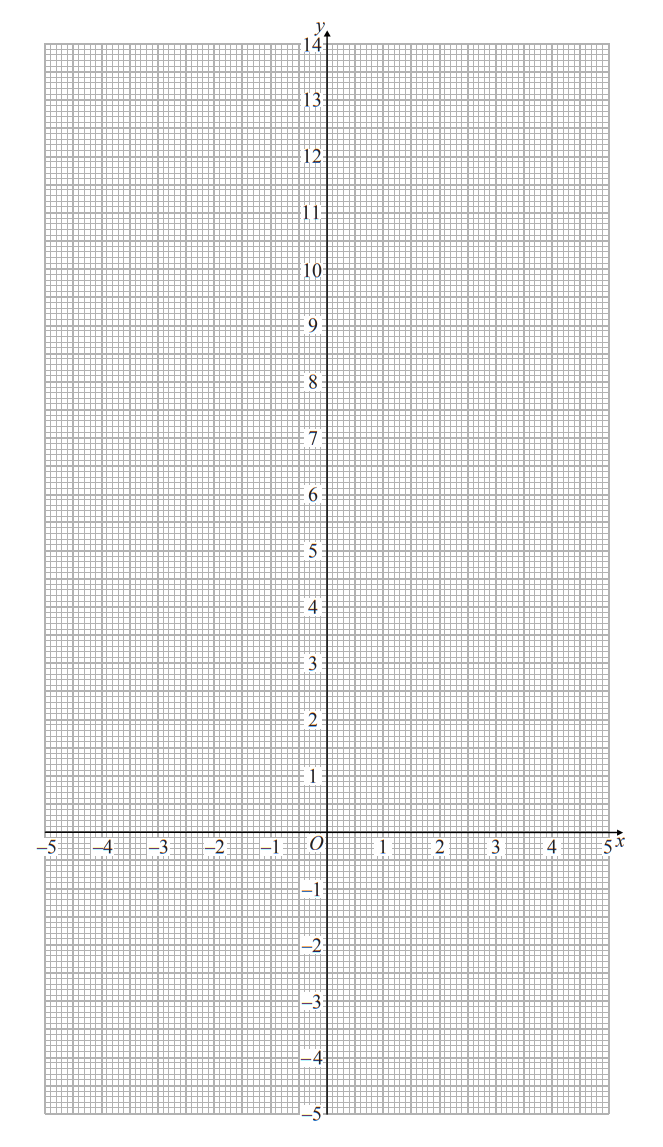
On the grid, draw the graph of y = 2(x2+1)+1 for  0x  5

Graph paper with x and y axes centred. X-axis ranges from -5 to 5, y-axis from -5 to 14, with grid squares visible.
1c
4 marks

By drawing a suitable straight line on the grid, obtain an estimate, to 1 decimal place, of the root of the equation log2 (4x  6)2   x = 2 in the interval 0  x  5

2a
3 marks

The curve C with equation

y = ax  5x  b

where a and b are integers, crosses the x-axis at the point (2.5, 0).

The asymptote to C which is parallel to the y-axis has equation x = 1

(i) Show that a = 2

(ii) Find the value of b.

2b
1 mark

Find the coordinates of the point where C crosses the y-axis.

2c
1 mark

Find the equation of the asymptote to C which is parallel to the x-axis.

2d
3 marks

Using the axes below, sketch the curve C showing clearly the asymptotes and the coordinates of the points where  C crosses the coordinate axes.

Cartesian coordinate system with horizontal x-axis and vertical y-axis meeting at origin marked O, arrows indicating positive directions.
3a
1 mark
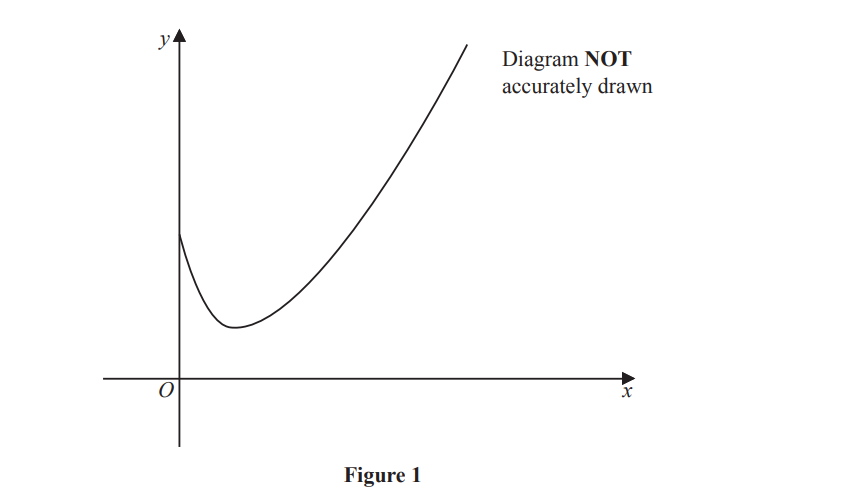
Graph of a curve on an xy-plane, resembling a parabola opening upwards. The text reads "Diagram NOT accurately drawn." Labelled as Figure 1.

Figure 1 shows a sketch of part of the curve C with equation

y = x24  3x+ 8

The point P lies on C and has coordinates (4, a)

Show that a = 6

3b
6 marks

The line Lis the normal to C at the point P

Show that an equation of L is 5y + 4x  46 =0

3c
6 marks

The finite region R is bounded by the curve C, the line L, the x-axis and the line with equation x = 1

Use calculus to find the exact area of R

4a
2 marks

The curve C has equation y = ax5bx where a and b are integers and x  b

One intersection of C with the coordinate axes is at the point with coordinates (54, 0)

The asymptote parallel to the y-axis has equation x = 3

Find the value of a and the value of b

4b
5 marks

Sketch  C, showing clearly the asymptotes with their equations and the coordinates of the points of intersection with the coordinate axes.

4c
9 marks

The straight line  l with equation 4y  7x = k has no points of intersection with C

Show, using algebra, that the range of possible values of k can be written as

m < k < n

where m and n are integers to be found.

5
4 marks
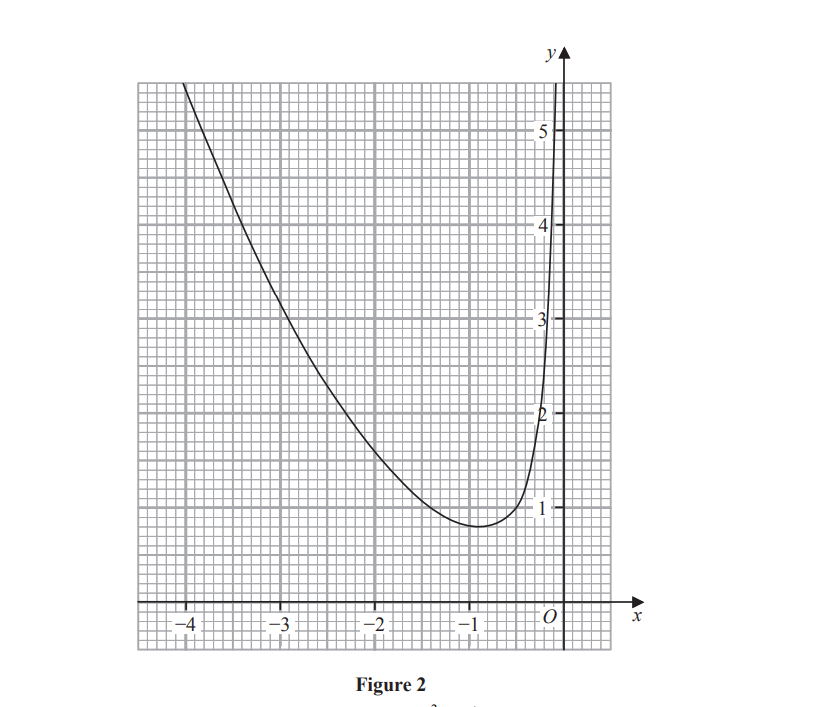
Graph showing a quadratic curve with a minimum point at approximately (-1, 0), labelled axes x and y, gridlines, and values from -4 to 5.

Figure 2 shows part of the curve with equation y = x23  12x for 4 < x < 0

By drawing a suitable straight line on the grid, obtain estimates, to one decimal place, of the roots of the equation 4x3 + 3x2 36x 6 = 0 in the interval 4 < x < 0

6a
2 marks

Complete the table of values for y=log10(6x1)x giving your answers to 2 decimal places.

x

0.25

0.5

1

1.5

2

2.5

3

y

-0.20

-0.30

-0.60

6b
2 marks

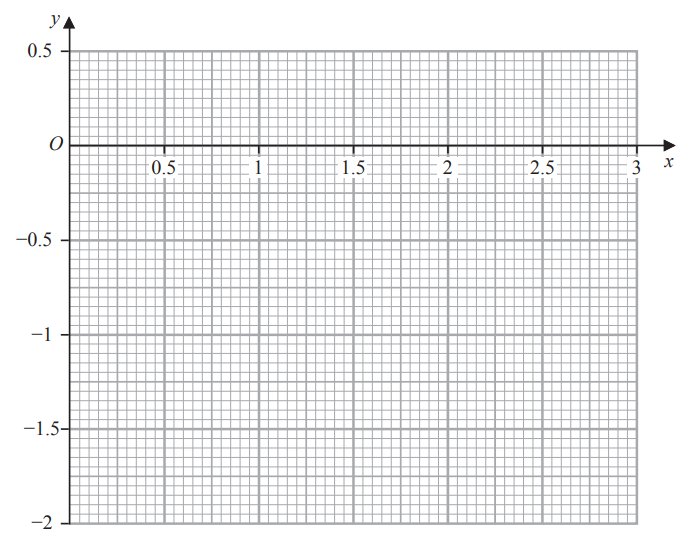
On the grid opposite, draw the graph of y=log10(6x1)x for 0.25x3

6c
4 marks

By drawing a suitable straight line on the grid, obtain an estimate, to one decimal place, of the root of the equation

103x42=6x1 in the interval 0.25x3

Graph with X-axis from 0 to 3 and Y-axis from -2 to 0.5, both labelled and marked at intervals of 0.5. Grid lines provide reference points.
7a
2 marks

A curve C has equation

y=5x23x+2       x23

Find the coordinates of the point where C intersects the

(i) x-axis

[1]

(ii) y-axis

[1]

7b
2 marks

A curve C has equation

y=5x23x+2       x23

Write down an equation of the asymptote to C that is

(i) parallel to the x-axis

[1]

(ii) parallel to the y-axis

[1]

7c
3 marks

Sketch C on the opposite page.
Show and label the asymptotes and the coordinates of the points where C crosses the coordinate axes.

7d
11 marks

Point A lies on C such that the gradient of C at Ais parallel to the line with equation 4yx7

The normal to C at Aintersects the x-axis at point Dand the y-axis at point E
Given that the x coordinate of A is positive,

find, in its simplified form, the exact length of line DE

Graph with x and y axes, arrows indicating positive directions. The intersection point is marked "O", representing the origin.
8
5 marks
Line graph with axes from 0 to 7, showing a curve decreasing steeply then rising gradually, labelled as Figure 1, with grid background.

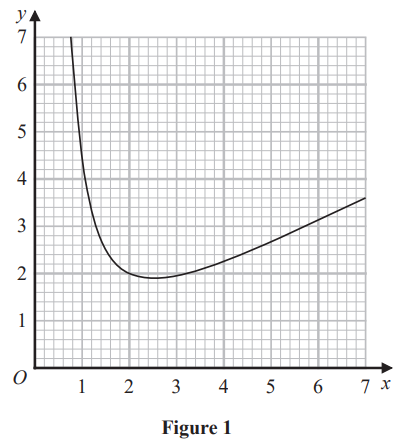
Figure 1 shows part of the curve with equation y=x2+4x2 in the interval 0.8<x<7

By drawing a suitable straight line on the grid, obtain an estimate, to one decimal place, of the roots of the equation 3x312x2+8=0 in the interval 0.8<x<7

9a
2 marks

The curve C with equation y=63xx4 where x≠ 4 , crosses the x-axis at the point P and the y-axis at the point Q

Find the coordinates of

(i) P

(ii) Q

9b
2 marks

The curve C with equation y=63xx4 where x≠ 4 , crosses the x-axis at the point P and the y-axis at the point Q

Write down an equation of the asymptote to C which is

(i) parallel to the y-axis

(ii) parallel to the x-axis

9c
3 marks

The curve C with equation y=63xx4 where x≠ 4 , crosses the x-axis at the point P and the y-axis at the point Q

Sketch C showing clearly the asymptotes and the coordinates of the points P and Q

9d
6 marks

The line L is the normal to C at the point on C where x=2

Find an equation of L

9e
3 marks

The line L intersects C again at the point R

Find the x coordinate of R

10a
2 marks

Curve C has equation y=ax+312x where x12and a is a constant.

The asymptote to C that is parallel to the x‑axis has equation y=4

Find the value of a

10b
1 mark

Write down the equation of the asymptote to C that is parallel to the y‑axis.

10c
2 marks

Find the coordinates of the point where C crosses

(i) the x‑axis,

(ii)  the y‑axis.

10d
4 marks

Using the axes below, sketch C, showing clearly the asymptotes and the coordinates of the points where C crosses the coordinate axes.

Coordinate plane with horizontal x-axis and vertical y-axis intersecting at origin O, marked with arrows indicating positive directions.
11a
2 marks

Complete the table of values for

y=0.5(x3+1)+2

giving each value to 2 decimal places where appropriate.

x

-6

-5

-4

-3

-2

-1

0

y

4

3.59

3.26

2.5

11b
2 marks

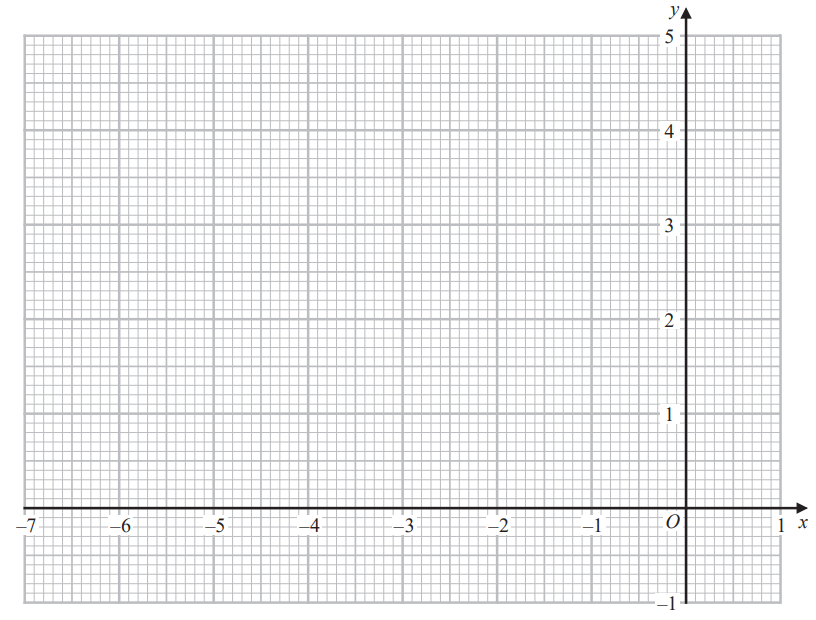
On the grid opposite, draw the graph of y=0.5(x3+1)+2 for 6x0

11c
6 marks

By drawing a suitable straight line on the grid, obtain an estimate, to one decimal place, of the root of the equation

log2(2x+2)3+x+3=0 in the interval 6x0

Graph with x-axis ranging from -7 to 1 and y-axis from -1 to 5, both labelled. Gridlines present for precision in plotting points.