Modelling Capacitor Discharge (OCR A Level Physics): Revision Note
Exam code: H556

Exponential Decay Graph for Capacitors
To verify if potential difference, V, or charge, Q, on a capacitor decreases exponentially:
Constant ratio method: Plot a V-t graph and check the time constant is constant, or check if the time to halve from its initial value is constant
Logarithmic graph method: Plot a graph of ln V against t and check if a straight line graph is obtained
Constant Ratio Method
A general form of the exponential decay question is given by
Where A is a constant
This equation shows that when t = A−1 the value of x will have decreased to approximately 37% of its original value, x0:
Comparing this to the discharge equation for a capacitor:
Therefore, for a discharging capacitor, when t = τ the potential difference on the capacitor will have decreased to approximately 37% of its original value
This means that equal intervals of time give equal fractional changes of in potential difference

The graph of voltage-time for a discharging capacitor showing the positions of the first three time constants
Hence, to validate if potential difference across a capacitor decreases exponentially:
The time constant, or the time taken for the potential difference to decrease to 37% of its original value, will be constant
To find the time constant from a voltage-time graph, calculate 0.37V0 and determine the corresponding time for that value

The time constant shown on a charging and discharging capacitor
Logarithmic Graph Method
The potential difference (p.d) across the capacitance is defined by the equation:

Where:
V = p.d. across the capacitor (V)
V0 = initial p.d. across the capacitor (V)
t = time (s)
e = exponential function
R = resistance of the resistor (Ω)
C = capacitance of the capacitor (F)
Rearranging this equation for ln(V) by taking the natural log (ln) of both sides:

Comparing this to the equation of a straight line: y = mx + c
y = ln (V)
x = t
gradient = −1/RC
c = ln (V0)
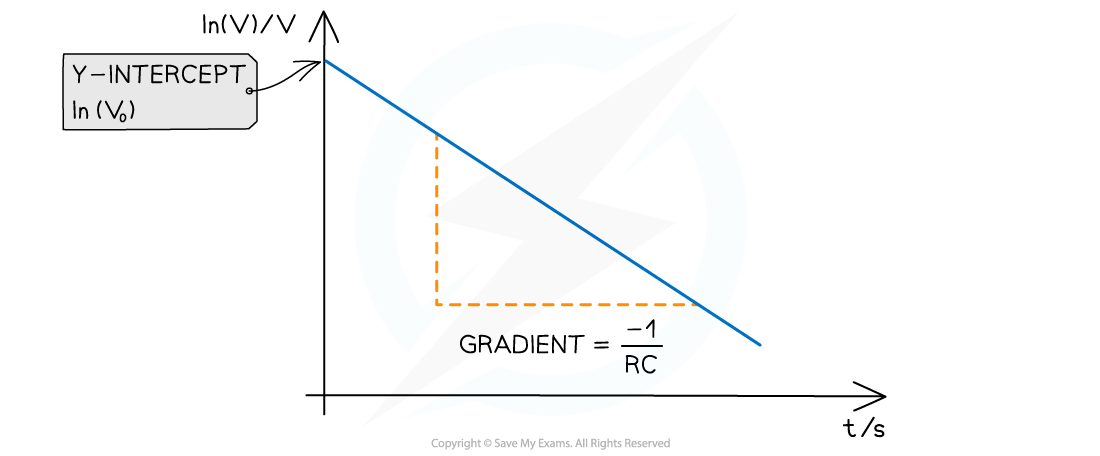
A straight-line logarithmic graph of ln V against t can be used to verify an exponential relationship
Worked Example
A student investigates the relationship between the potential difference and the time it takes to discharge a capacitor. They obtain the following results:
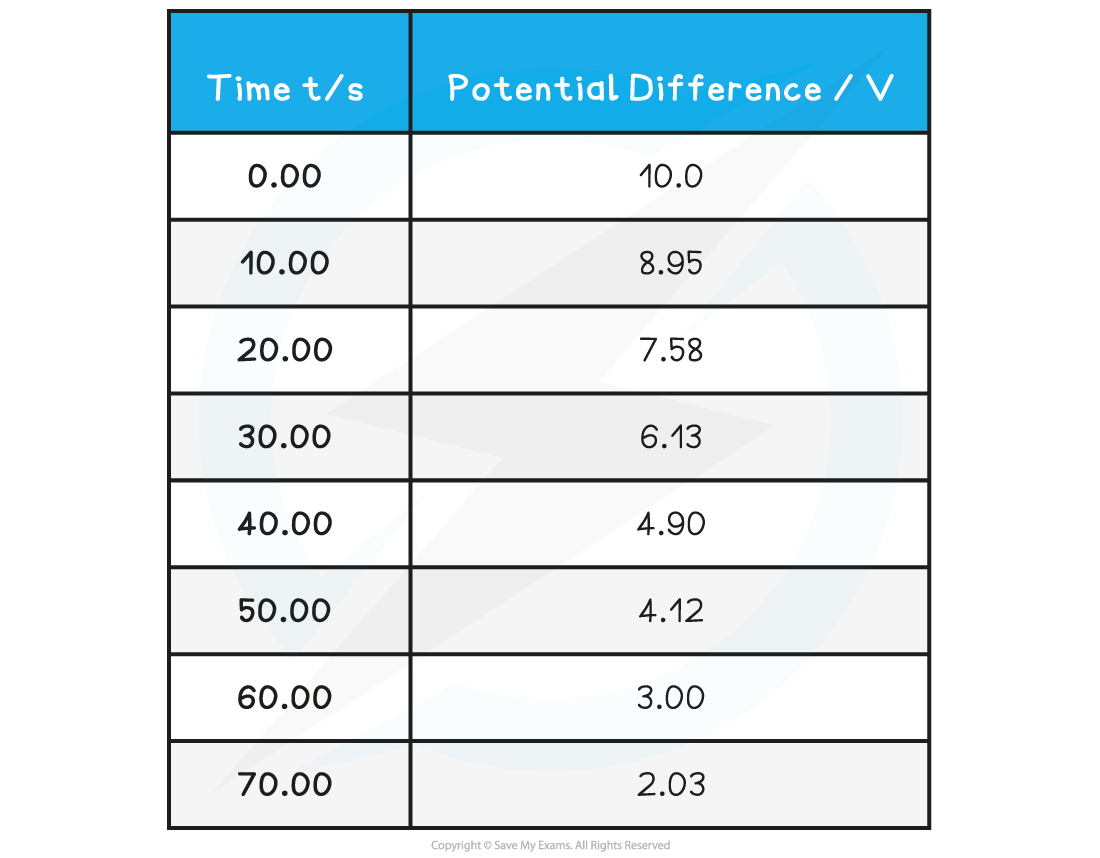
The capacitor is labelled with a capacitance of 4200 µF.
Calculate the value of the capacitance of the capacitor discharged.
Answer:
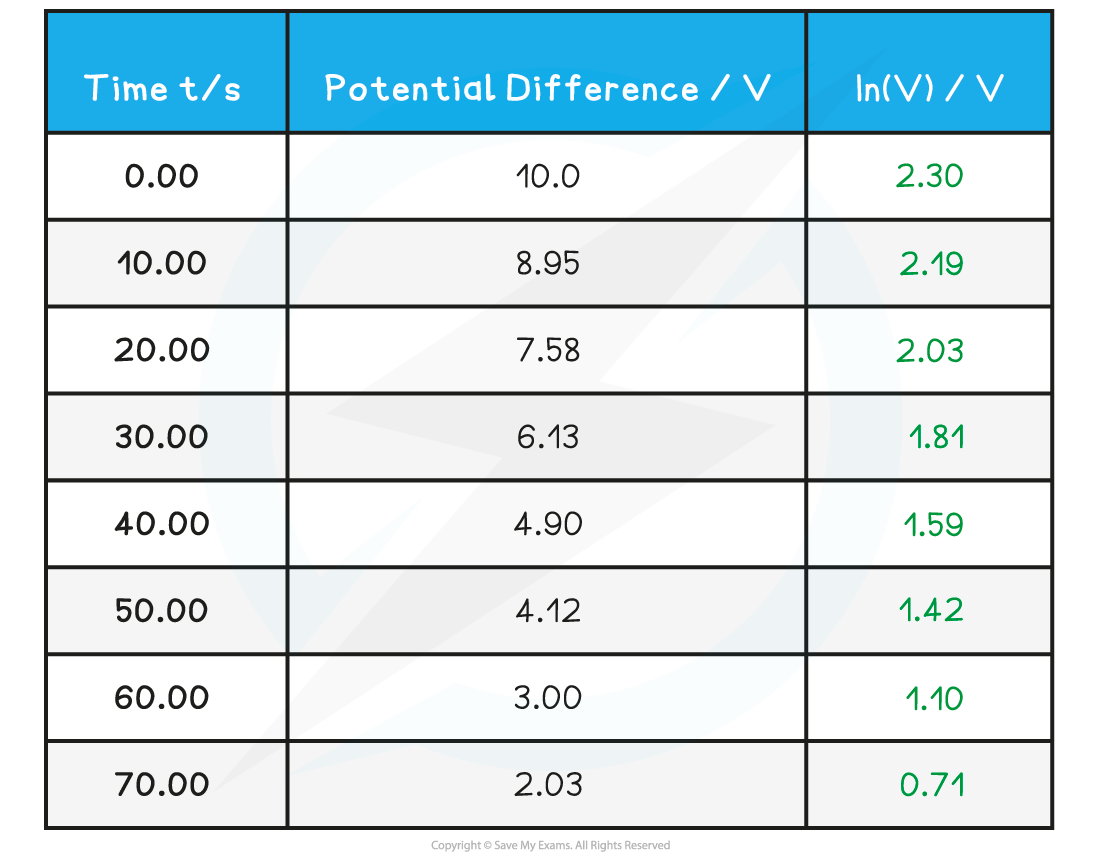
Step 1: Complete the table
Add an extra column ln(V) and calculate this for each p.d.
Step 2: Plot the graph of ln(V) against average time t
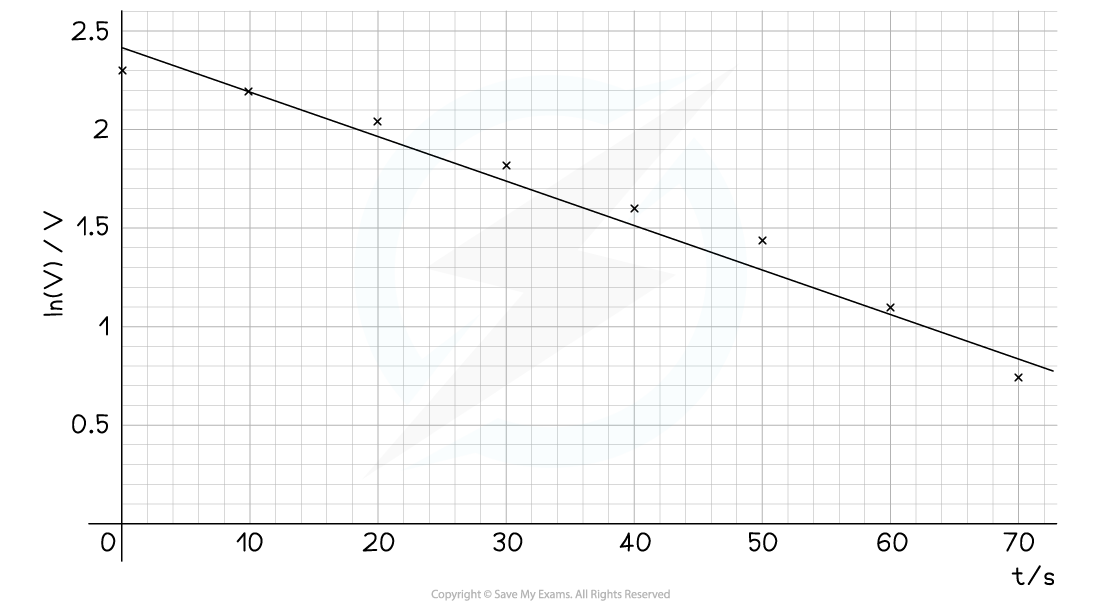
Make sure the axes are properly labelled and the line of best fit is drawn with a ruler
Step 3: Calculate the gradient of the graph
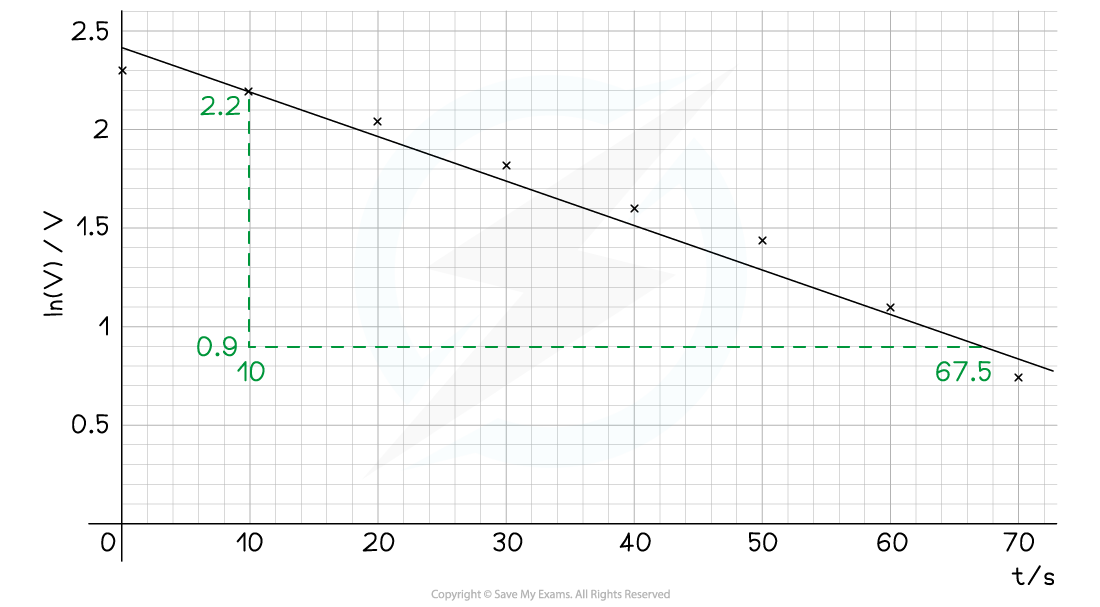
The gradient is calculated by:

Step 4: Calculate the capacitance, C


Modelling the Discharge of a Capacitor
From electricity, the charge is defined as:
ΔQ = IΔt
Where:
I = current (A)
ΔQ = change in charge (C)
Δt = change in time (s)
This means that the area under a current-time graph for a charging (or discharging) capacitor is the charge stored for a certain time interval
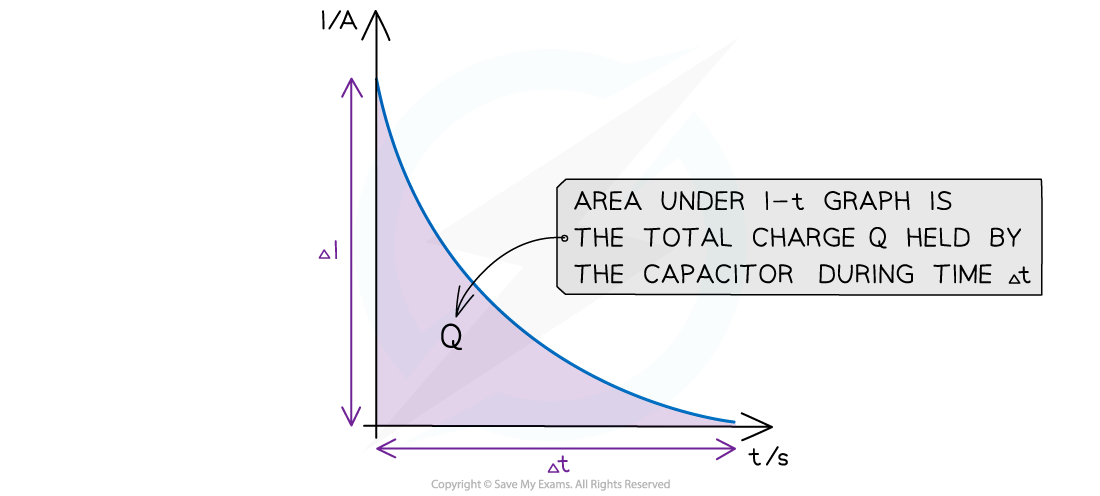
The area under the I-t graph is the total charge stored in the capacitor in the time interval Δt
Rearranging for the current:

This means that the gradient of the charge-time graph is the current at that time
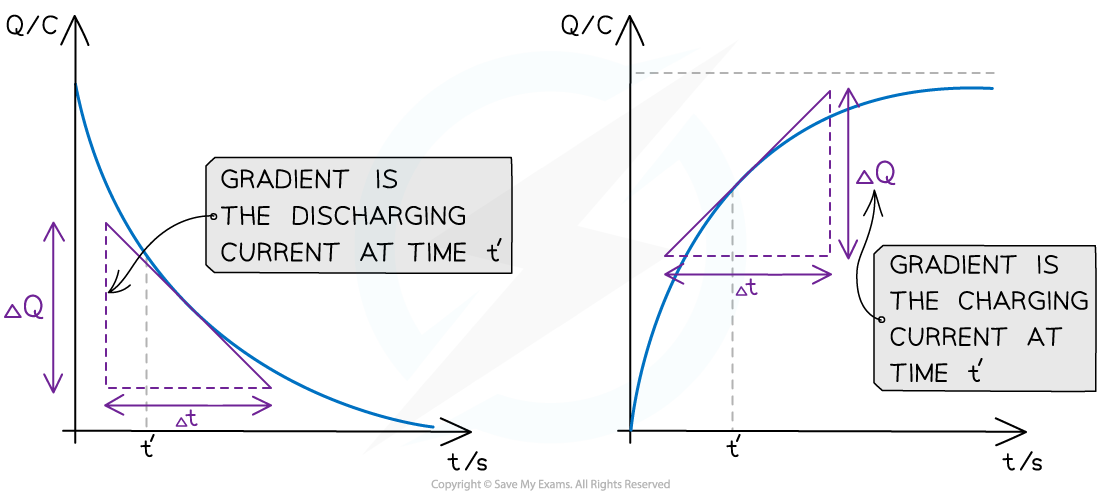
The gradient of a discharging and charging Q-t graph is the current
In the discharging graph, this is the discharging current at that time
In the charging graph, this is the charging current at that time
To calculate the gradient of a curve, draw a tangent at that point and calculate the gradient of that tangent
As a capacitor charges or discharges, the current at any time can be found from Ohm's law:
From the definition of capacitance, the value of potential difference at any time is given by:
Combining these equations gives:
For a discharging capacitor, the current decreases with time, hence:
This leads to an expression which can be used to solve for the time constant of a discharging capacitor:
This equation is useful for modelling using spreadsheets
Worked Example
The graph below shows how the charge stored on a capacitor with capacitance C varies with time as it discharges through a resistor.
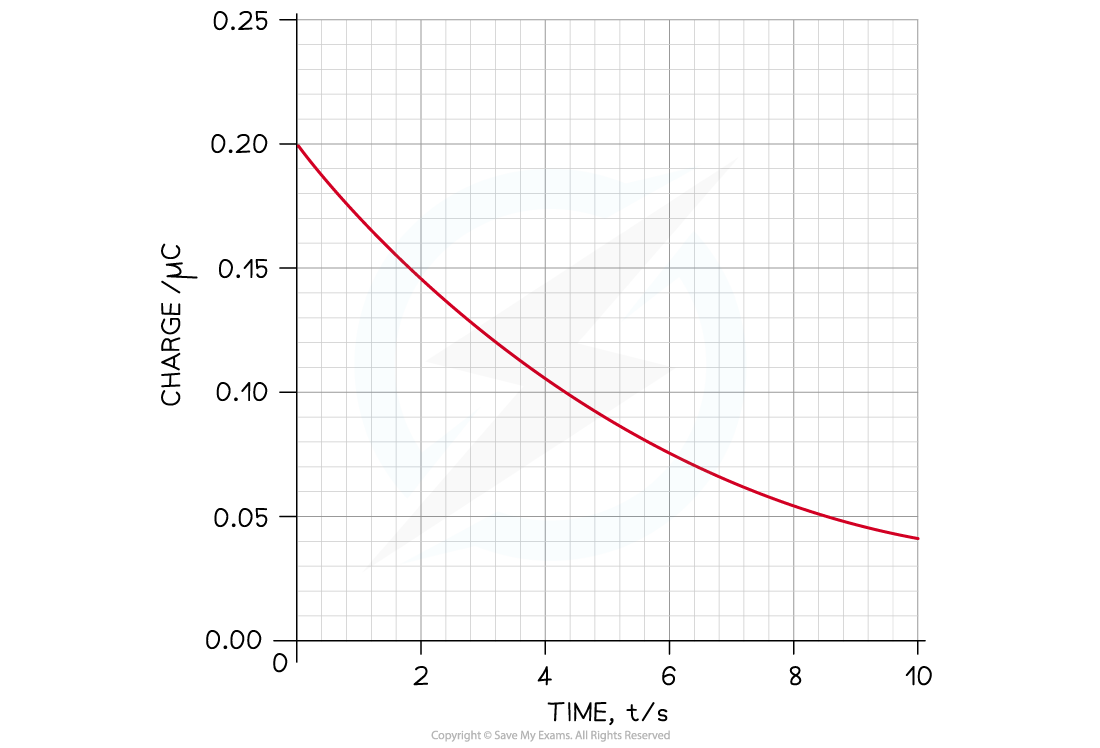
Calculate the current through the circuit after 4 s.
Answer:
Step 1: Draw a tangent at t = 4
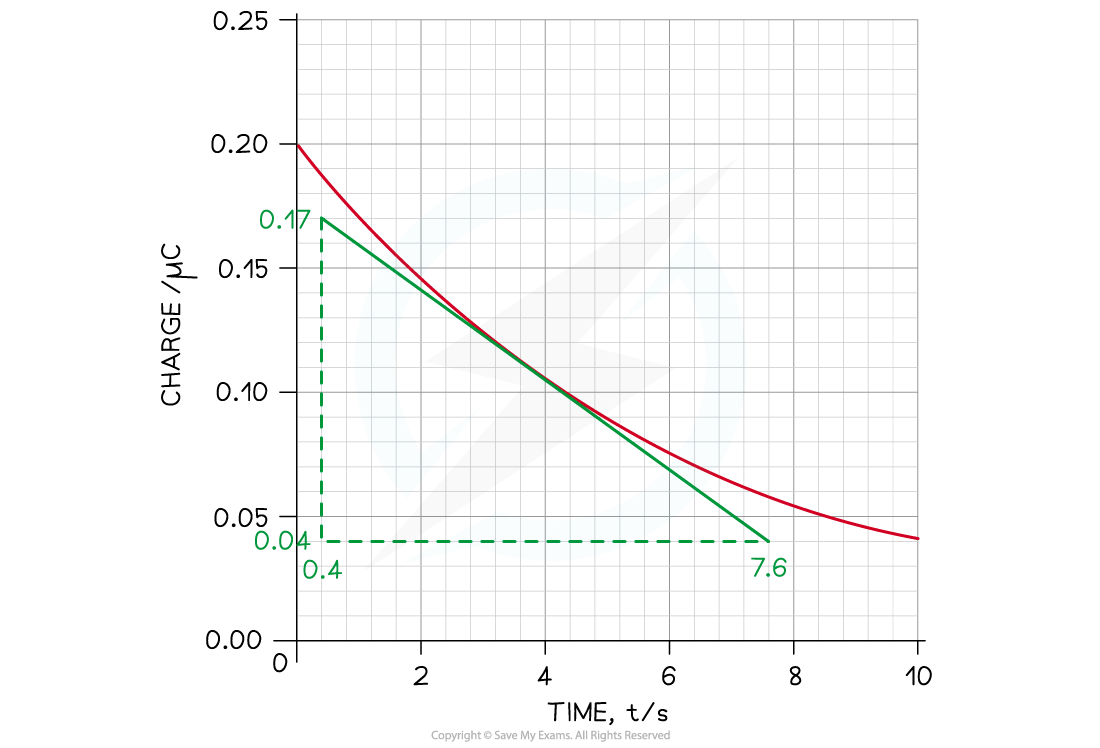
Step 2: Calculate the gradient of the tangent to find the current I


Unlock more, it's free!
Join the 100,000+ Students that ❤️ Save My Exams
the (exam) results speak for themselves:

Was this revision note helpful?
Build on this topic