Syllabus Edition
First teaching 2025
First exams 2027
Movements Along and Shifts of the PPC (Cambridge (CIE) IGCSE Economics): Revision Note
Exam code: 0455 & 0987

Movements along a PPC
A movement in the PPC occurs when there is any change in the allocation of existing resources within an economy, such as the movement from point C to D

Diagram explanation
The use of PPC to depict opportunity cost
To produce one more unit of capital goods, this economy must give up production of some units of consumer goods (limited resources)
If this economy moves from point C (120, 150) to point D (225, 100), the opportunity cost of producing an additional 105 units of consumer goods is 50 capital goods
Resources have been reallocated in the economy
Shifts of a PPC
As opposed to a movement along the PPC described above, the entire PPC of an economy can shift inward or outward
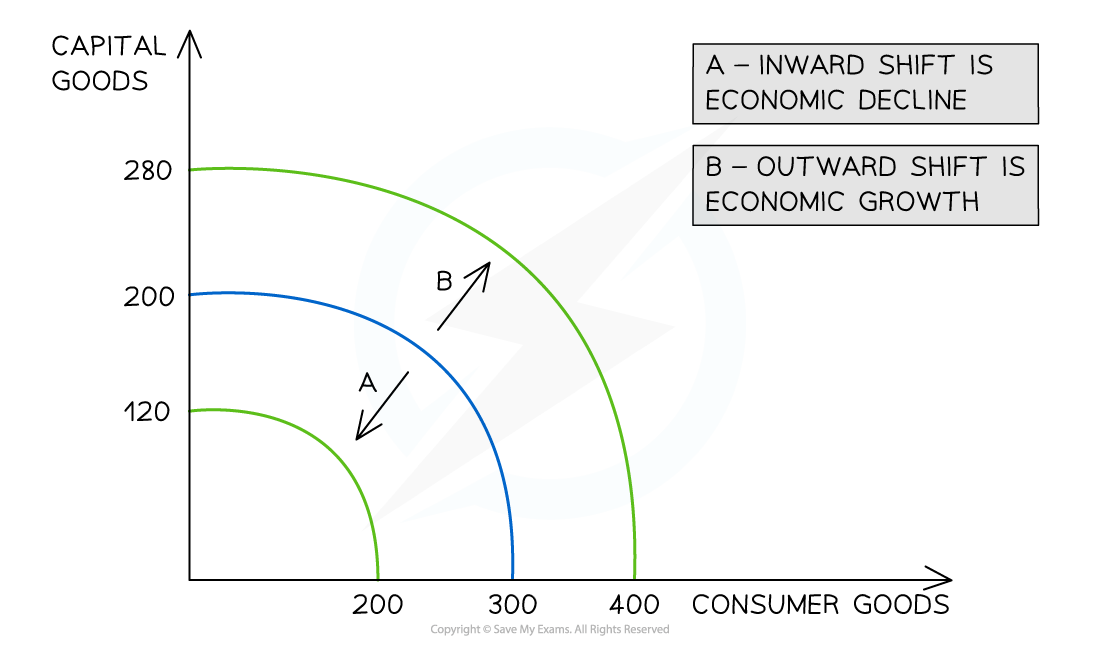
Diagram explanation
Economic growth occurs when there is an increase in the productive potential of an economy
This is demonstrated by an outward shift (B) of the entire curve
More consumer goods and more capital goods can now be produced using all of the available resources
This shift is caused by an increase in the quality or quantity of the available factors of production
One example of how the quality of a factor of production can be improved is through the impact of training and education on labour
An educated workforce is a more productive workforce and the production possibilities increase
One example of how the quantity of a factor of production can be increased is through a change in migration policies
If an economy allows more foreign workers to work productively in the economy, then production possibilities increase
Economic decline occurs when there is any impact on an economy that reduces the quantity or quality of the available factors of production
This is demonstrated by an inward shift (A) of the entire curve
One example of how this may happen is to consider how the Japanese tsunami of 2011 devastated the production possibilities of Japan for many years
It shifted their PPC inward and resulted in economic decline

Unlock more, it's free!
Join the 100,000+ Students that ❤️ Save My Exams
the (exam) results speak for themselves:

Was this revision note helpful?
