Costs of Production (Cambridge (CIE) IGCSE Economics): Revision Note
Syllabus Edition
First teaching 2025
First exams 2027
Exam code: 0455 & 0987

What are costs of production?
In preparing goods and services for sale, firms incur a range of costs. These costs of production can be be broken into different categories:
Fixed costs (FC)
These are costs that do not change as the level of output changes
They have to be paid whether output is zero or 5000
For example, building rent, management salaries, insurance and bank loan repayments
Variable costs (VC)
These are costs that vary directly with output
These increase as output increases and vice versa
For example, raw material costs and wages of workers directly involved in production
Total costs (TC)
These are the sum of the fixed and the total variable costs
Cost calculations
Based on the above definitions, we can calculate several different types of costs
1. Total costs (TC)
2. Total variable costs (TVC)
3. Average total costs (ATC)
4. Average fixed costs (AFC)
5. Average variable costs (AVC)
Worked Example
Calculate all relevant business costs using the following data:
Variable cost is $60
The fixed cost is $200
Output (Q) | TFC | TVC = | TC = | AFC = | AVC = | ATC = |
|---|---|---|---|---|---|---|
0 | 200 | - | 200 | - | - | - |
1 | 200 | 60 | 260 | 200 | 60 | 260 |
2 | 200 | 120 | 320 | 100 | 60 | 160 |
3 | 200 | 180 | 380 | 66.67 | 60 | 126.67 |
4 | 200 | 240 | 440 | 50 | 60 | 110 |
5 | 200 | 300 | 500 | 40 | 60 | 100 |
6 | 200 | 360 | 560 | 33.34 | 60 | 93.33 |
7 | 200 | 420 | 620 | 28.58 | 60 | 88.57 |
8 | 200 | 480 | 680 | 25 | 60 | 85 |
Drawing and interpreting cost diagrams
Fixed costs (FC)

The firm has to pay its fixed costs which do not change, irrespective if the output is 0 or 100,000 units
The fixed costs for this firm are $4,000
Variable costs (VC)
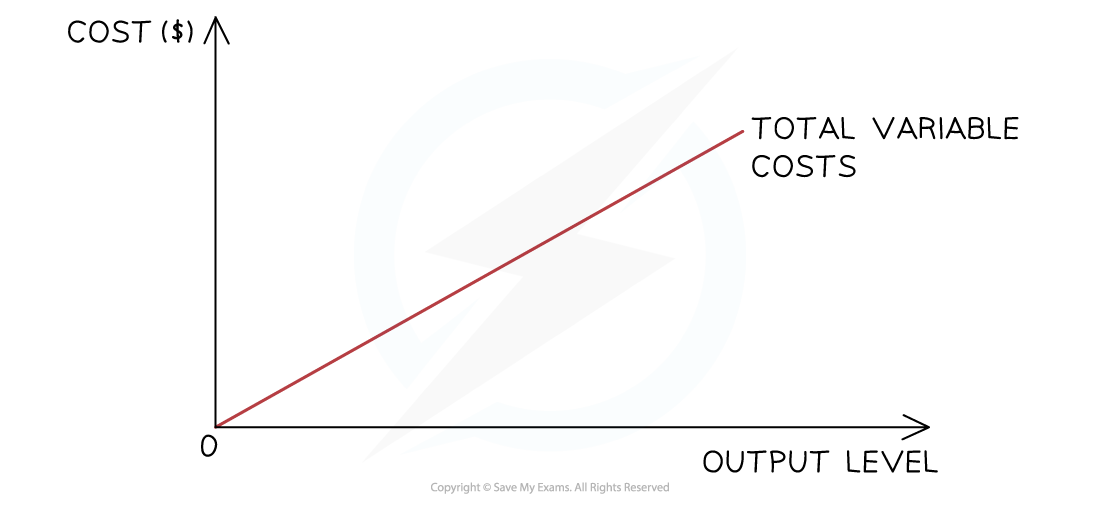
The variable costs initially rise proportionally with output, as shown in the diagram
At some point the firm will benefit from a purchasing economy of scale and the rise will no longer be proportional
Total cost (TC)
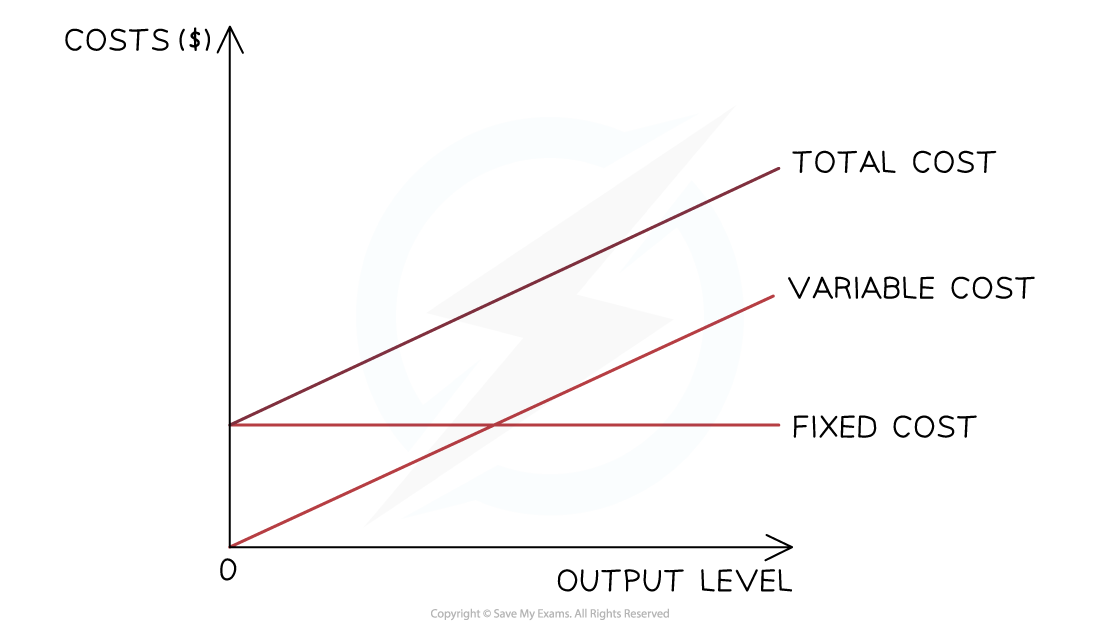
The total cost is the sum of the variable and fixed costs
The total costs cannot be 0, as all firms have some level of fixed costs
Average fixed cost (AFC)

If the fixed costs of a firm are $1,000 and it produces 1 unit of output, then its AFC is $1,000 ($1,000/1)
If the firm increases its output to 1000 units, then the AFC is $1 per unit ($1000/1,000)
The more units a firm produces, the lower its AFC will be
This is one reasons why large levels of output help to increase the profit per unit
Average total cost (ATC)

As a firm grows, it is able to increases its scale of output generating efficiencies that lower its average total costs (AC) of production
These efficiencies are called economies of scale
As a firm continues increasing its scale of output, it will reach a point where its average total costs (AC) start to increase
The reasons for the increase in the average costs are called diseconomies of scale
Examiner Tips and Tricks
MCQ frequently tests your knowledge of these curves by presenting you with 4 unlabelled diagrams and, for example, asking you to identify which sketch demonstrates the average fixed costs of the firm.

Unlock more, it's free!
Join the 100,000+ Students that ❤️ Save My Exams
the (exam) results speak for themselves:

Was this revision note helpful?
Build on this topic