Answering 4-Mark Questions (Cambridge (CIE) IGCSE Economics): Revision Note
Syllabus Edition
First teaching 2025
First exams 2027
Exam code: 0455 & 0987

How do I answer IGCSE economics 4-mark questions?
To answer IGCSE Economics 4-mark questions, consider the following:
4-mark questions appear in both Section A and Section B of Paper 2.
The most common command terms used for these questions are:
Explain
Analyse
Draw
1. Explain
These questions require two explanations, each developed with a cause → effect chain
Each explanation can score up to 2 marks:
1 mark for the cause/reason
1 mark for development
They test AO2 analysis, not evaluation
Worked Example
Explain two causes of an increase in the price elasticity of demand for rice.
Model Answer
Consumers may have more substitutes available, such as pasta or potatoes (1),
making them more responsive to a price change in rice (1).
Rice may now account for a smaller proportion of consumer income (1), meaning households can more easily change quantity demanded when price changes (1)
Examiner Tips and Tricks
Each point must be different
Do not write the same idea twice with different wording
2. Analyse
These questions test deeper analytical thinking about relationships between variables, economic behaviour, or data patterns
They require two chains of analysis, each linking cause → effect
1 mark for the analytical point
1 mark for development
× 2 = 4 marks
Worked Example
Analyse the relationship between life expectancy and the net migration rate
Model Answer
Higher life expectancy suggests better healthcare and living standards (1),
attracting migrants looking for improved welfare (1)
A higher net migration rate increases the working-age population (1),
creating more tax revenue that can improve healthcare and raise life expectancy (1)
Examiner Tips and Tricks
Always show a directional relationship: “as X increases, Y tends to…”
3. Draw
These questions assess diagram accuracy and understanding
You must draw a fully labelled diagram showing the correct economic change
No written explanation is required unless explicitly stated
The marks allocation is usually as follows:
1 mark for correct axes
1 mark for correct original curves
1 mark for correct shift
1 mark for new equilibrium
Worked Example
Draw a demand and supply diagram to show the effect of an increase in vegetarianism on the market for tomatoes
Model Answer
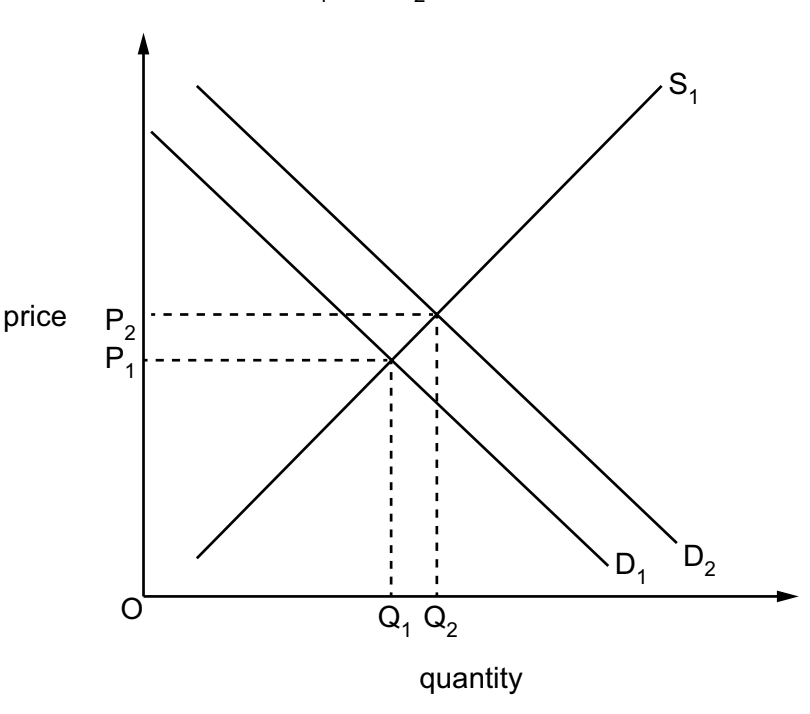
1 mark for correct axes
1 mark for correct original curves
1 mark for rightward shift to D₂
1 mark for new equilibrium P₂ and quantity Q₂
Examiner Tips and Tricks
A missing label = a lost mark
Neatness is not marked; accuracy is – but neatness helps you spot inaccuracies!

Unlock more, it's free!
Join the 100,000+ Students that ❤️ Save My Exams
the (exam) results speak for themselves:

Was this revision note helpful?