Syllabus Edition
First teaching 2025
First exams 2027
Movements Along & Shifts of the Supply Curve (Cambridge (CIE) IGCSE Economics): Revision Note
Exam code: 0455 & 0987

Movements along a supply curve
If price is the only factor that changes (ceteris paribus), there will be a change in the quantity supplied (QS)
This change is shown by a movement along the supply curve
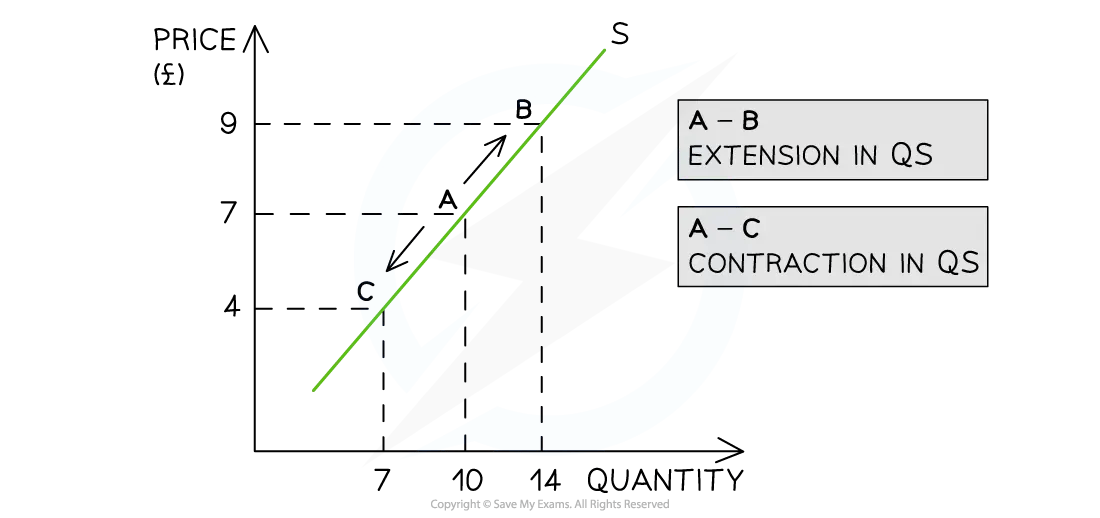
Diagram analysis
An increase in price from £7 to £9 leads to a movement up the supply curve from point A to B
Due to the increase in price, the quantity supplied has increased from 10 to 14 units
This movement is called an extension in quantity supplied
A decrease in price from £7 to £4 leads to a movement down the supply curve from point A to C
Due to the decrease in price, the quantity supplied has decreased from 10 to 7 units
This movement is called a contraction in quantity supplied
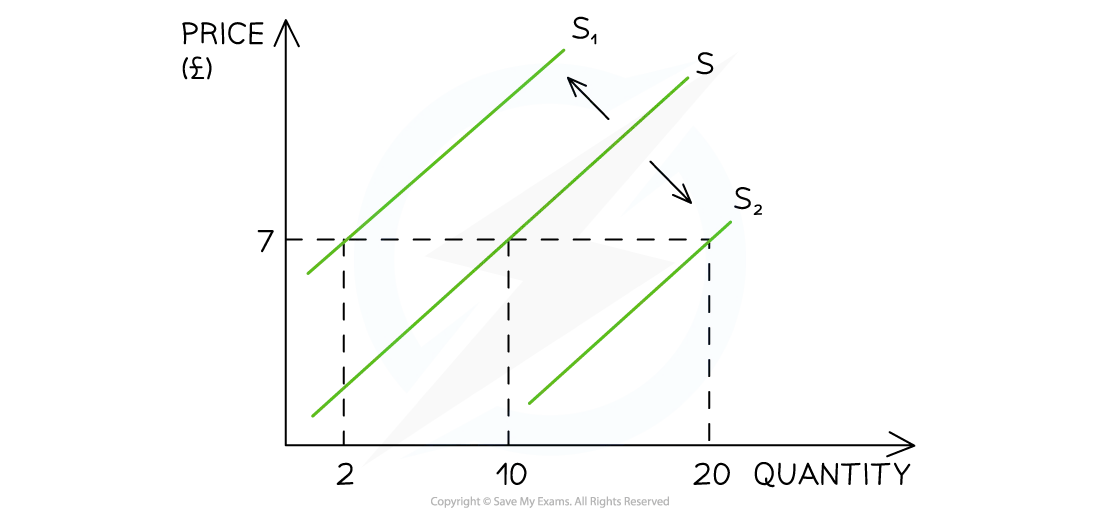
Shifts of the supply curve
There are several factors that will change the supply of a good or service, irrespective of the price level
Collectively, these factors are called the conditions of supply and include:
Changes to the costs of production
Changes to indirect taxes and subsidies
Changes to technology
Changes to the number of firms
Weather events
Future price expectations
Goods in joint and competitive supply
Changes to any of the conditions of supply shift the entire supply curve (as opposed to a movement along the supply curve)

For example, if a firm's cost of production increases due to the increase in price of a key resource, then there will be a decrease in supply as the firm can now only afford to produce fewer products
This is a shift in supply from S to S1. The price remains unchanged at £7 but the supply has decreased from 10 to 2 units
Causes of changes to the conditions of supply
1. Changes to the costs of production
If the price of raw materials or other costs of production change, firms respond by changing supply.
If costs of production increase
Supply decreases and shifts left (S→S1)
For example, rising aluminium prices increase bicycle production costs in Malaysia, causing supply to fall
If costs of production decrease
Supply increases and shifts right (S→S2)
2. Changes to indirect taxes
Any change to indirect taxes changes the cost of production for a firm and impacts supply
If indirect taxes increase
Supply decreases and shifts left (S→S1)
For example, a higher sugar tax in Thailand raises costs for soft drink producers, reducing supply
If indirect taxes decrease
Supply increases and shifts right (S→S2)
3. Changes to subsidies
Changes to producer subsidies directly impact the cost of production for the firm
If subsidies increase
Supply increases and shifts right (S→S2)
If subsidies decrease
Supply decreases and shifts left (S→S1)
For example, the removal of farming subsidies in Argentina reduces agricultural output
4. Changes to the state of technology
New technology increases productivity and lowers costs of production
Ageing technology can have the opposite effect
If technology improves
Supply increases and shifts right (S→S2)
For example, new irrigation systems in Morocco help farmers produce more crops with less water
If technology worsens
Supply decreases and shifts left (S→S1)
5. Change in the number of firms in the industry
The entry and exit of firms into the market has a direct impact on the supply
If ten new firms start selling building materials in Hanoi, the supply of building material will increase
If the number of firms increases
Supply increases and shifts right (S→S2)
If the number of firms decreases
Supply decreases and shifts left (S→S1)
For example, several electronics factories close in South Africa due to constant power outages, reducing supply
6. Weather events
Droughts or flooding can cause a supply shock in agricultural markets
A drought will cause supply to decrease
Unexpectedly good growing conditions can cause supply to increase
If the weather is good
Supply increases and shifts right (S→S2)
For example, ideal monsoon rains boost rice production in India
If the weather is bad
Supply decreases and shifts left (S→S1)
For example, severe drought in Kenya reduces the coffee harvest, lowering supply
7. Future price expectations
Producers base their supply decisions not only on current prices, but also on what they expect prices to be in the future
Changes in expectations cause a shift of the supply curve
If prices are expected to rise in the future
Producers will prefer to sell later at the higher expected price
This means they:
Hold back stock now
Reduce current supply
Shift the supply curve left
Result: Supply decreases (S → S₁)
Example: Farmers store grain if they expect higher prices next month
If prices are expected to fall in the future
Producers will prefer to sell now before prices drop
This means they:
Release more stock onto the market
Increase current supply
Shift the supply curve right
Result: Supply increases (S → S₂)
Example: Oil producers increase current exports if they expect global prices to fall
Summary Table
Expectation about future price | Effect on current supply | Direction of shift |
|---|---|---|
Prices expected to rise | Supply decreases | Left |
Prices expected to fall | Supply increases | Right |
Examiner Tips and Tricks
Several of the conditions of supply change the costs of production. However, be sure to explain each condition as a standalone point before linking it to the cost of production (for example, a change in indirect taxation).
A common error by students is to explain that a subsidy (for example, a £3,000 subsidy for each electric vehicle produced) shifts the demand curve for electric vehicles to the right. This is incorrect. The subsidy will shift the supply curve to the right. Then, due to the lower price, there will be a movement along the demand curve (extension of quantity demanded) to create a new market equilibrium.

Unlock more, it's free!
Join the 100,000+ Students that ❤️ Save My Exams
the (exam) results speak for themselves:

Was this revision note helpful?
