Syllabus Edition
First teaching 2025
First exams 2027
Effects of Changing Population Sizes (Cambridge (CIE) IGCSE Economics): Revision Note
Exam code: 0455 & 0987

The optimum population
Overpopulation occurs when there are more people in a country/region than can be supported by its resources and technology and leads to
Higher levels of pollution
Higher crime rates
Higher unemployment or underemployment
Higher levels of food and water shortages
Higher pressure on services such as hospitals and schools
Underpopulation occurs when there are more resources available than the population can use effectively and may lead to
Fewer people paying tax which can lead to higher taxes
Underused resources, which can lead to wastage
A shortage of workers
Lower levels of exports and production, which affects the wealth of an area
Fewer customers for goods and services
Optimum population occurs when there is a balance between the number of people and available resources/technology
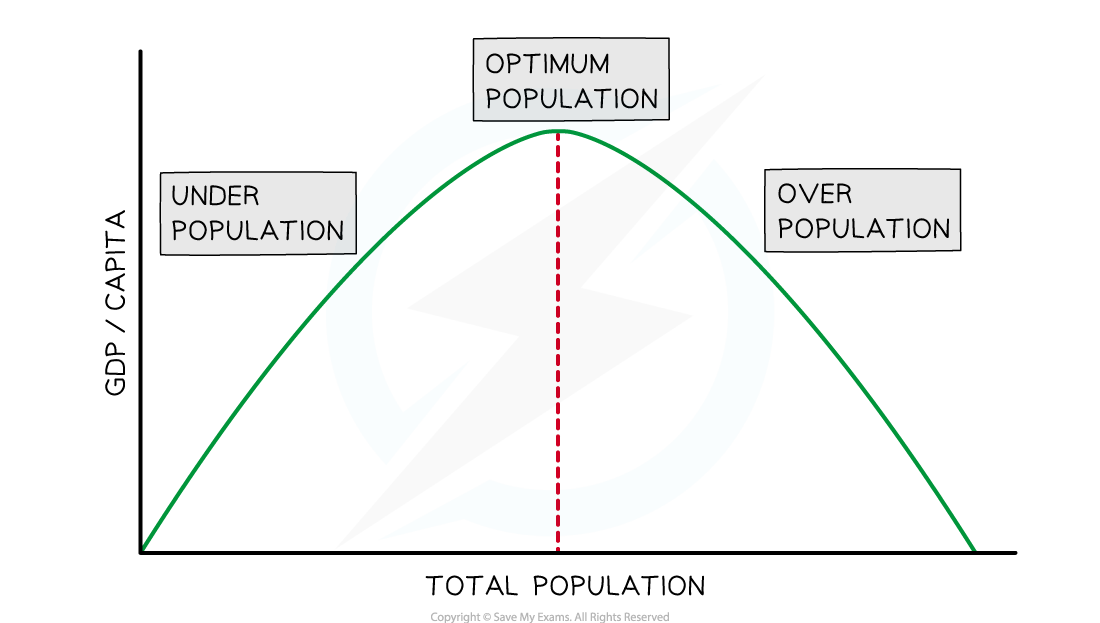
The optimum population results in the highest standard of living
There are not so many people or so few resources that the standard of living falls
There are enough people to develop the resources of the country
Examiner Tips and Tricks
It is important to remember that overpopulation does not just mean there are a lot of people, and underpopulation means there are few people. The terms refer to the balance between population and resources. There may be many people in a country, but it is only overpopulated when there are too few resources to support that population.
Population distribution
The characteristics of a population (the distribution of age, sex, ethnicity, religion etc), is known as the population structure
The population structure is the result of changes in:
the birth rate
the death rate
net migration
The two main characteristics of age and sex can be shown on a population pyramid
Population pyramids
Population pyramids are used to display the gender and age structure of a given population
They illustrate the distribution of population across age groups and between male/female
Population pyramids can be used to identify the following groups:
Young dependents
Old dependants, e.g. number of retired people
Economically active (working population or labour force)
Dependency ratio
Example 1: Niger as a less economically developed country (LEDC)

LEDCs like Niger have a concave pyramid shape which indicates
High birth rate
Low life expectancy
High death rate but starting to decrease (people dying through every age group)
High infant mortality rate (significant decrease between 0-5)
Young dependent population dominates the distribution
Example 2: USA as a more economically developed country (MEDC)

This population pyramid indicates:
Decreasing birth rate - there is a smaller population reading down from age 29
Increasing life expectancy – indicated by the relatively straight sides reaching the age of 70, followed by a good proportion of people living much longer
Decreasing death rate – indicated by the relatively straight sides reaching the age of 70
Low infant mortality - hardly any change between 0-9 years
Larger working age population - 15 to 69 represents a large proportion of the population
Examiner Tips and Tricks
Population pyramids are not included in your examination. We have left them in here, as they are a useful tool for understanding the term 'population distribution'. The visual pyramid quickly helps us to understand differences in population distribution.
Effects of population changes
Population changes can have major impacts within the economy, resulting in changes to consumption, production, lifestyle, standards of living and government policies (fiscal, monetary and supply-side)
Typical changes that occur are
Progressively ageing populations as economies develop
Falling birth rates as economies develop
Swings in net migration as influenced by war, famine, natural disasters and government policy
Ageing populations
Many developed economies are experiencing ageing populations and an increase in the older dependent population
The implications of this include
Increased pension payments by governments
Increased need for care homes (public and private)
Increased pressure on the healthcare service and social care results in higher government spending
It also results in a smaller labour force and often Governments collect less tax
Firms suffer worker shortages
Labour shortages result in increased wage costs for firms
Falling birth rates
Falling birth rates have the following impact on an economy
School closures due to fewer children
Future labour shortages
Governments typically put in place incentives that encourage families to have more children
Governments may change the migration laws to encourage immigration so that labour shortages are prevented
Excessive immigration can change the nature and culture of different regions within a country
Migration
In some countries migration can lead to an imbalance in the population structure e.g. the UAE has significantly more males than females
Rapid population growth caused by migration can lead to
Increased pressure on services such as healthcare and schools resulting in increased costs for government
A shortage of housing which generates social issues in society
Increased traffic congestion, which is a negative externality
Increased water and air pollution, which are negative externalities
Food shortages

Unlock more, it's free!
Join the 100,000+ Students that ❤️ Save My Exams
the (exam) results speak for themselves:

Was this revision note helpful?
