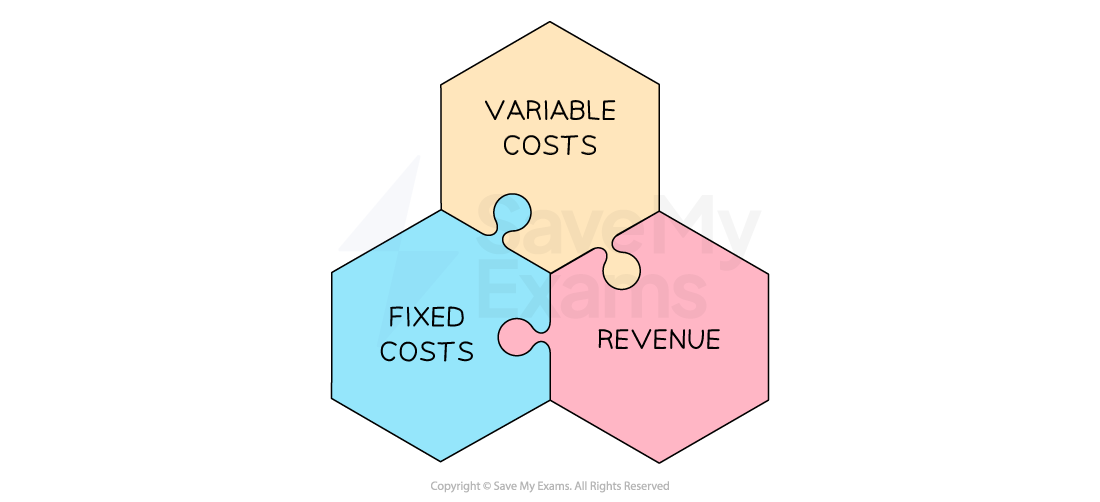
The Importance of Break-Even (OCR GCSE Business): Revision Note
Exam code: J204
The concept of break-even
Break-even analysis is a financial tool used to determine the number of units a business must sell to reach a point where its revenue equals its expenses (neither profit nor loss)
It helps businesses understand the minimum level of sales or output they need to achieve in order to cover all costs
This helps business managers make informed decisions about pricing and production volumes

Fixed costs are costs that do not change regardless of the level of production or sales
They remain the same at every level of output
E.g. Rent, salaries and insurance
Variable costs are costs that vary with the level of production or sales
They increase in direct proportion with the level of output
E.g. Raw materials, direct labour costs, packaging and shipping costs
Total costs are the sum of fixed costs and total variable costs at a particular level of output, calculated using the formula
Revenue is the money gained from selling products, calculated using the formula
Calculating break-even
The break-even point is expressed as a number of units and is calculated using the formula:
Examiner Tips and Tricks
You should always round UP the outcome of the formula to the nearest whole unit.
Worked Example
Marlon's Burgers has the following financial information for the month of May.
| £ |
Raw materials for each burger | 2.10 |
Packaging for each burger | 0.20 |
Fixed costs | 1 ,730 |
Selling price of each burger | 4.95 |
(a) Using the information in the table, calculate the level of output required to break even in May. You are advised to show your workings. [3 marks]
Step 1: Calculate the variable costs per burger
[1]
Step 2: Substitute the values into the break-even formula
[1]
Step 3: Round up to the nearest whole unit
653.83 is rounded up to 654
654 burgers need to be sold in order to break even [1]
Interpreting break-even graphs
A break-even chart is a visual representation of the break-even point in a graph
The chart can also be used to identify:
Profit or loss at different levels of output
The margin of safety, which is the difference between the actual level of output and the break-even point
Three lines are plotted on a graph with an x-axis labelled units and a y axis labelled costs/revenues
Fixed costs
Total costs
Revenue
The break-even point is the output level at which the revenue and total costs line intersect
Case Study
Vic's Vans is a small electric van rental business.
Variable costs are £7.60 per rental
Fixed costs are £8,000
The rental price of each van is £32 per day
Fixed costs, variable costs, total costs and revenue at different levels of output
Units | 0 | 100 | 300 | 500 |
|---|---|---|---|---|
Variable costs (£) | 0 | 760 | 2,280 | 3,800 |
Fixed costs (£) | 8,000 | 8,000 | 8,000 | 8,000 |
Total costs (£) | 8,000 | 8,760 | 10,280 | 11,800 |
Revenue (£) | 0 | 3,200 | 9,600 | 16,000 |
This data is used to construct Vic's Van's break even chart:

Fixed costs do not change as output increases
They are represented by a horizontal line at £8,000 for all levels of output
Total costs are made up of fixed and variable costs
The total costs line slopes upwards because total variable costs increase as output increases
Revenue increases as output rises
The revenue line slopes upward more steeply than total costs, eventually crossing the total costs line
The point at which the total costs and the revenue lines cross is the break-even point
In this example, the break-even level of output is 328 units
The margin of safety is the difference between the actual level of output and the break-even output
In this case, the margin of safety is:
The profit made at a specific level of output can be identified as the space between the revenue and total costs lines
At 450 units, the profit made is:
Examiner Tips and Tricks
You will not be required to draw a break-even chart in the exam but you could be asked to manipulate a diagram that has been provided
You could be asked to
Illustrate a change to the selling price, variable costs or fixed costs on the diagram
Mark the break-even point or margin of safety
Identify the amount of profit (or loss) made at a given level of output
Label elements such as axis names or cost/revenue curves

Unlock more, it's free!
Was this revision note helpful?
