Carrying Capacity (AQA A Level Biology): Revision Note
Exam code: 7402

Carrying capacity
The maximum stable population size of a species that an ecosystem can support is known as the carrying capacity
Although all individuals can potentially reproduce, abiotic and biotic factors limit survival and reproduction
This ensures the population size of each species is limited at some point (i.e. the carrying capacity of that species is reached)
Most species remain below or at carrying capacity due to these limiting factors
Humans are a possible exception, as we've overcome many natural limitations
The graph below shows the population growth of a population of lions
The point at which the graph started to flatten out (plateau) is the carrying capacity of this population
At this point, the environmental (abiotic and biotic) factors that stop all individuals from surviving and reproducing result in the population no longer being able to grow in size

Factors affecting population size
Abiotic factors
Abiotic factors involve the non-living parts of an ecosystem
Some examples of abiotic factors that can limit population size include:
light availability
water supply
temperature
amount of space available
soil pH
If environmental temperature is far from a mammal’s optimum, individuals use more energy to maintain their optimum body temperature (via homeostasis), leaving less energy for growth and reproduction
Fewer reach reproductive age, so population growth is limited
Biotic factors
Biotic factors involve the living parts of an ecosystem
Biotic factors are the interactions between organisms
This includes things like competition for resources and predation
Biotic factors can be split into three main types:
Interspecific competition
Intraspecific competition
Predation
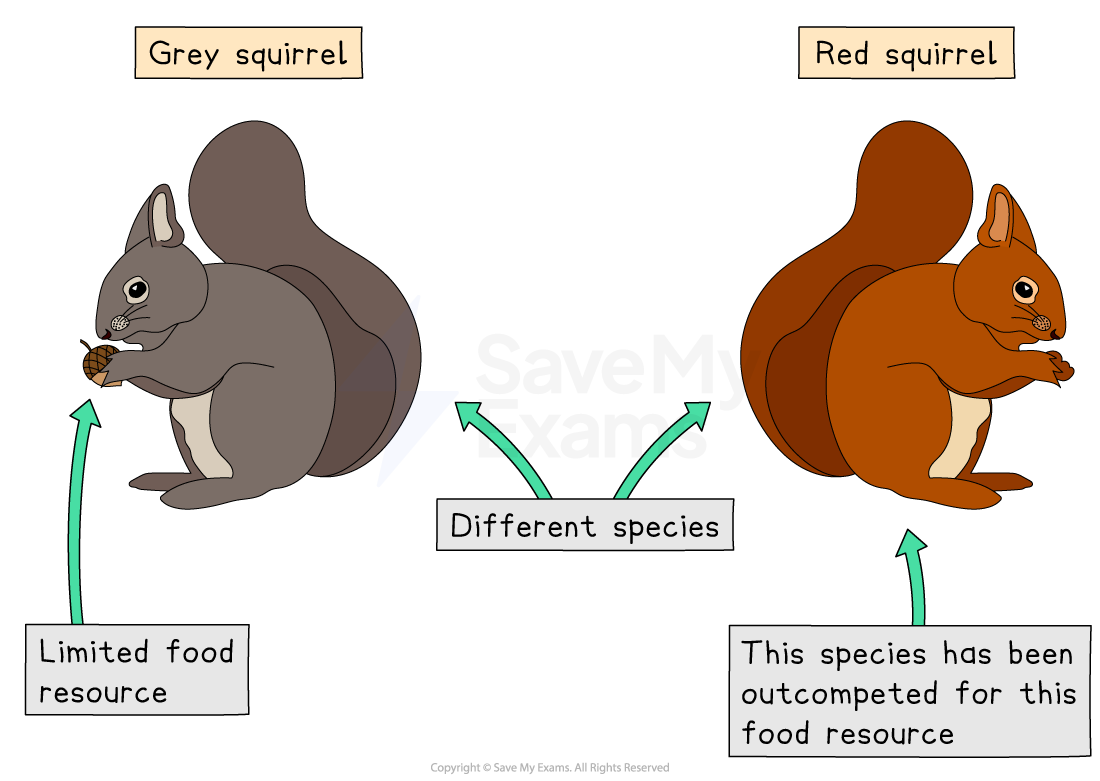
Interspecific competition
Occurs when different species compete for the same resources (e.g. food, space, nesting sites)
Can limit both populations if species are similarly adapted, as resources are shared
If one species is better adapted, it may outcompete the other:
The weaker competitor declines in number or is excluded
For example, in the UK, grey squirrels outcompete red squirrels because:
Grey squirrels eat a wider range of food
They are also larger and have better fat storage in winter
This leads to greater survival and reproduction
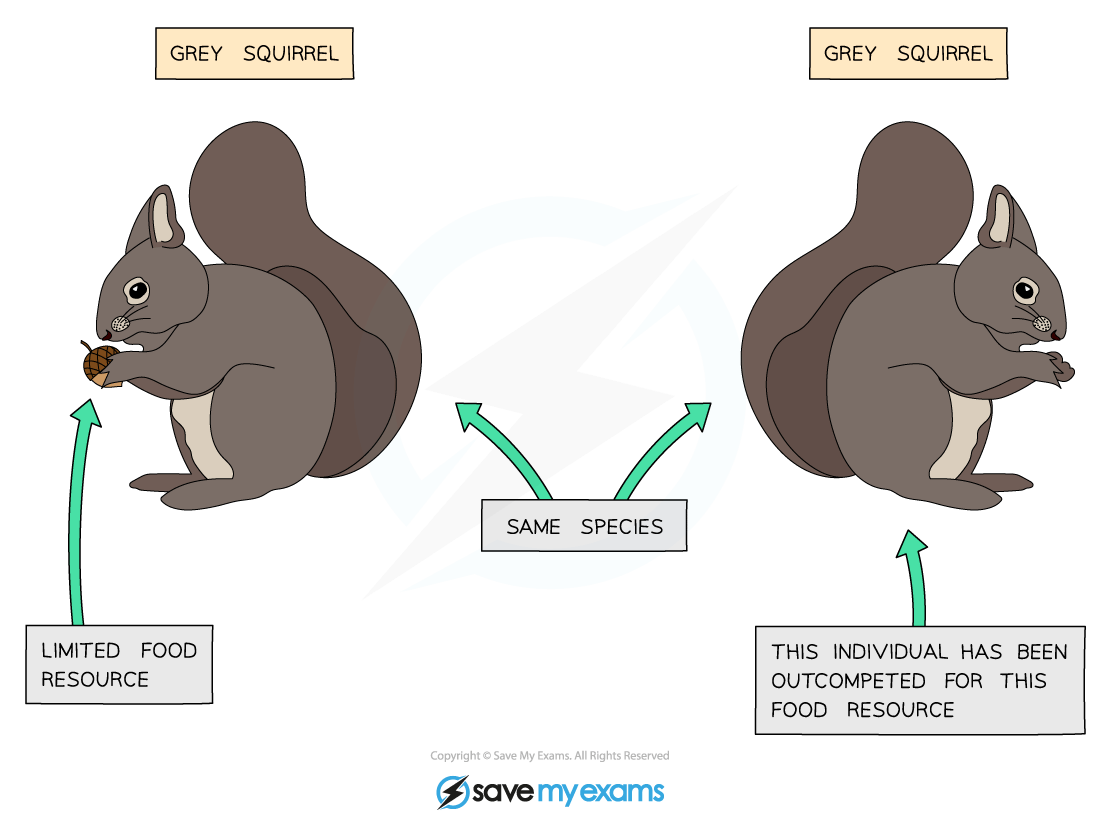
Intraspecific competition
This is competition for the same resources between individuals from the same species
For example: grey squirrels compete with grey squirrels
When resources are plentiful, grey squirrel numbers increase
More individuals compete for food and shelter
Resources become limiting, so the population stabilises at the carrying capacity
Predation
Producers are eaten by primary consumers, which in turn may be eaten by secondary consumers who are themselves eaten by tertiary consumers
Predators are consumers that kill and eat prey
In a stable community, predator and prey populations cycle as follows:
Prey numbers rise → meaning there is more food for predators
Predator numbers rise → so more prey is eaten
Prey numbers fall → therefore there is less food for predators
Predator numbers fall → meaning less pressure on prey
Prey numbers rise again → cycle repeats


Unlock more, it's free!
Join the 100,000+ Students that ❤️ Save My Exams
the (exam) results speak for themselves:

Was this revision note helpful?
