Syllabus Edition
First teaching 2025
First exams 2027
Break-Even Analysis (Cambridge (CIE) IGCSE Business): Revision Note
Exam code: 0450, 0986 & 0264, 0774
The concept of break-even
The break-even point is the number of units that need to be sold for total costs to equal the sales revenue
It helps businesses understand the minimum level of sales or output they need to achieve in order to cover all costs
This helps business managers to make informed decisions about pricing and production volumes
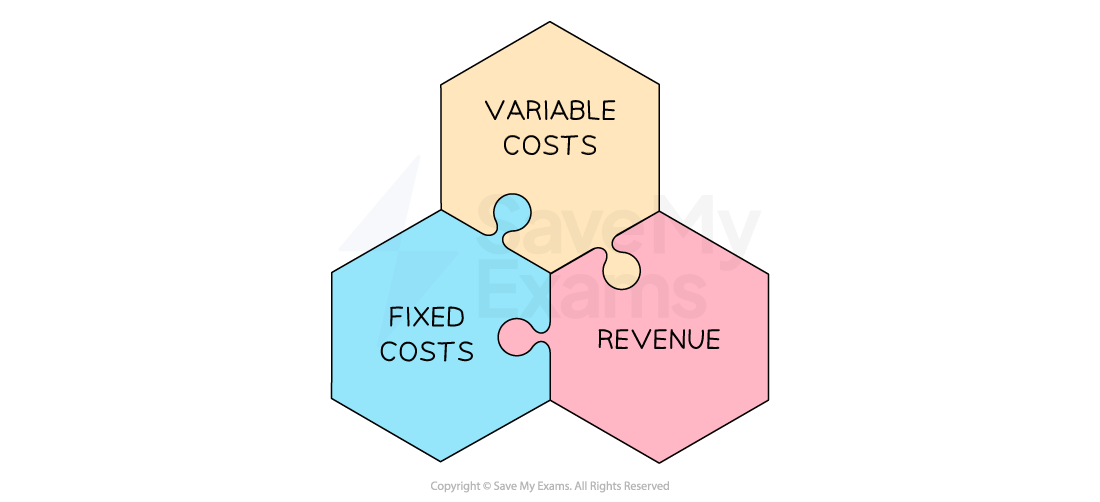
Elements of a break-even analysis

Fixed costs do not change, regardless of the level of production or sales
E.g. rent, salaries and insurance
Variable costs vary with the level of production or sales
E.g. raw materials, direct labour costs, packaging and shipping costs
Sales revenue is money gained from selling products, calculated using the formula
The break-even chart
Break-even charts show the number of units a business must sell in order to break-even
In order to construct a break-even chart, the business needs to know the estimated fixed costs, variable costs and sales revenue
Worked Example
Steps to construct a break-even chart
Step 1: Identify fixed costs, variable costs and sales revenue at different levels of output
Tee Crazy Ltd has the following cost and revenue data:
Fixed costs are $8,800 per year
The variable costs of each t-shirt is $4
Each t-shirt is sold for a price of $10
Its factory can produce a maximum output of 3000 t-shirts per year
Costs and revenue summary for Tee-Crazy Ltd.
| 0 units | 500 units | 3000 units |
|---|---|---|---|
Fixed Costs | 8,800 | 8,800 | 8,800 |
Variable Costs | 0 | 2,000 | 12,000 |
Total Costs | 8,800 | 10,800 | 20,800 |
Total Revenue | 0 | 5,000 | 30,000 |
Step 2: Draw the axes and plot the fixed costs line
The x-axis should extend to the maximum output level
In this case it extends to 3,000 units
The y-axis should extend to the highest value in the table
In this case the highest value is $30,000

The fixed cost line is a horizontal line at $8,800, as fixed costs remain constant at all levels of output
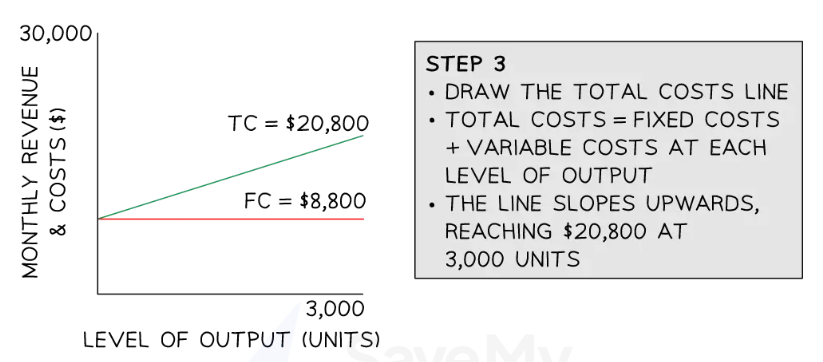
Step 3: Plot the total costs line

The total cost line slopes upwards, starting at $8,800 at 0 units of output, rising to $20,800 at 3,000 units of output
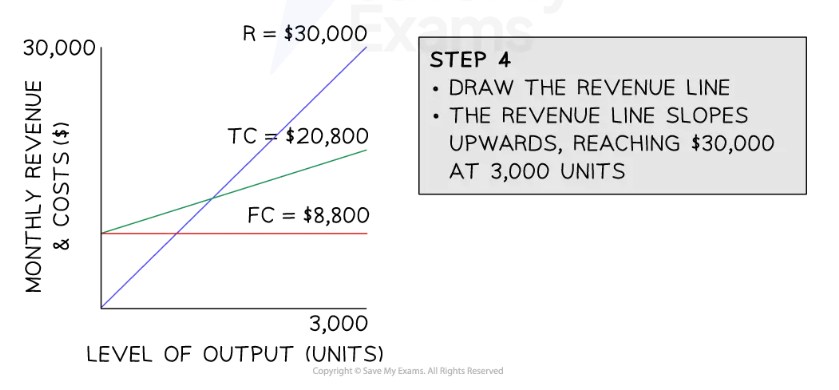
Step 4: Plot the revenue line

The revenue line slopes upwards, starting at $0 at 0 units of output, rising to $30,000 at 3,000 units of output
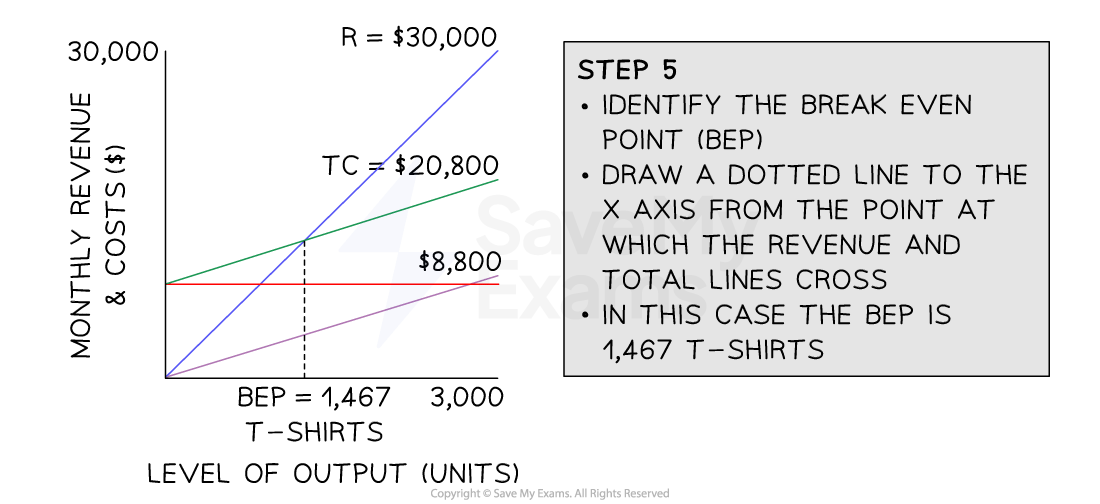
Step 5: Identify the break-even point

The break-even point is where the revenue line crosses the total costs line
Read the break-even output on the x-axis
In this case, the break-even point is 1,467 units
Examiner Tips and Tricks
When drawing break-even charts, label all key elements clearly – fixed costs, total costs, total revenue, and break-even point – as missing labels often loses easy marks
Calculating break-even output
The break-even point can be calculated using the formula
Worked Example
Mięsisty Burgers has the following financial information for the month of May
| € May |
|---|---|
Raw materials for each burger | 2.10 |
Packaging for each burger | 0.20 |
Fixed costs | 1730 |
Selling price of each burger | 4.95 |
Using the information in the table, calculate the level of output required to break even in May. You are advised to show your workings.
(3)
Step 1: Calculate the variable costs per burger
(1)
Step 2: Substitute the values into the break-even formula
(1)
Step 3: Round to the nearest unit
653 burgers need to be sold to break even in May (1)
Examiner Tips and Tricks
Always round up the break-even point to the nearest whole unit
The margin of safety
The margin of safety is the amount by which the number of units sold is greater than the break-even point
The margin of safety provides useful information to a firm on how many sales they could lose before they start making a loss
The margin of safety can be calculated using the following formula:
Businesses want their margin of safety to be as large as possible
This means that if demand for their products drops unexpectedly, the business will continue to make a profit
Worked Example
The diagram shows the weekly break-even diagram for the Yorkshire Rare Breed Sausage Company. On average, the business sells 3,200 units each week.

Using the diagram, calculate the weekly margin of safety. Show your workings and the formula used.
(2)
Step 1: Identify the break-even output from the graph
= 2,500 units (1)
Step 2: Subtract the break-even output from the actual output
(1)
Examiner Tips and Tricks
Use a ruler to help you to read break-even charts accurately.

Unlock more, it's free!
Was this revision note helpful?
