Syllabus Edition
First teaching 2025
First exams 2027
Using Break-Even Analysis to Make Decisions (Cambridge (CIE) IGCSE Business): Revision Note
Exam code: 0450, 0986 & 0264, 0774
Break-even analysis and decision-making
Break-even calculations are a useful tool for a business to use in deciding how much to produce and calculating estimated levels of profit
It is particularly useful for communicating with stakeholders, including investors or lenders
Knowing when the business will break-even or how much profit it is expected to make may attract or deter shareholders from investing in the business
Break-even analysis provides a basis for informed decision-making
It helps the business to assess the costs and expected returns of new projects and expansion plans
By considering the break-even point, businesses can assess the potential risks and rewards associated with different decisions
Ways break-even is used in decision-making
Use | How break-even analysis helps |
|---|---|
Assessing profit or loss |
|
Managing costs |
|
Pricing decisions |
|
Financial planning |
|
Redrawing the graph with changes |
|
Performance monitoring |
|
Changes to break-even variables
Changing any of the variables of break-even (selling price, variable cost per unit or total fixed costs) changes the break-even point and level of profit it can expect to achieve
Increased selling price
An increase in the selling price reduces the break-even point

An increase in the selling price increases revenue at each level of output from R1 to R2
The break-even point falls from BEP1 to BEP2
Profit on each unit of output greater than the break-even point is increased
Decreased selling price
A decrease in the selling price increases the break-even point

A decrease in the selling price reduces revenue at each level of output from R1 to R2
The break-even point rises from BEP1 to BEP2
Profit on each unit of output greater than the break-even point is decreased
Increased variable costs
An increase in variable costs increases the break-even point

An increase in variable costs increases total costs at each level of output from TC1 to TC2
The break-even point increases from BEP1 to BEP2
Profit on each unit of output greater than the break-even point is decreased
Decreased variable costs
A decrease in variable costs decreases the break-even point

A decrease in variable costs decreases total costs at each level of output from TC1 to TC2
The break-even point falls from BEP1 to BEP2
Profit on each unit of output greater than the break-even point is increased
Increased fixed costs
An increase in fixed costs increases the break-even point

An increase in fixed costs increases total costs at each level of output from TC1 to TC2
The break-even point increases from BEP1 to BEP2
Profit on each unit of output greater than the break-even point is decreased
Decreased fixed costs
A decrease in fixed costs decreases the break-even point

A decrease in fixed costs reduces total costs at each level of output from TC1 to TC2
The break-even point falls from BEP1 to BEP2
Profit on each unit of output greater than the break-even point is increased
Examiner Tips and Tricks
Strengthen your answers by linking changes in price, costs or sales volume to shifts in the break-even point and margin of safety – this application gains higher marks
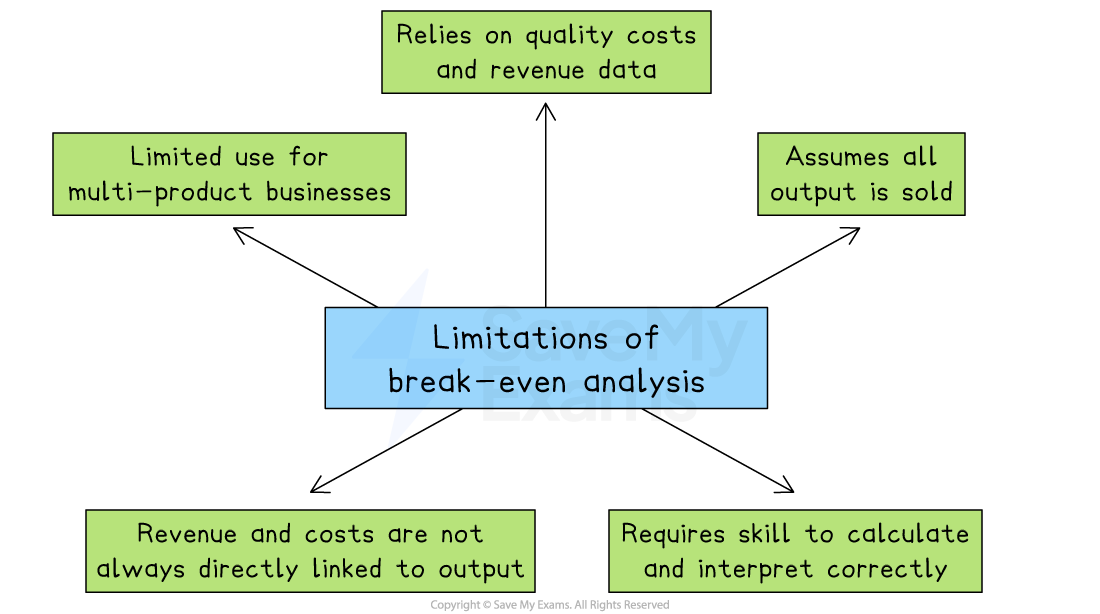
Limitations of break-even analysis
Break-even analysis provides valuable insights into the financial viability and performance of a business
The sooner a business can reach break-even point, the more likely it is to survive and make a profit
However, there are several limitations to the use of break-even analysis

1. Limited use for multi-product businesses
Break-even analysis works best for businesses that sell one product
If a business sells many products with different prices and profit margins, it is difficult to calculate a single break-even point that applies to all of them
2. Relies on quality costs and revenue data
The results are only accurate if the data used is correct
If the business uses outdated or incorrect cost or revenue figures, the break-even point will be misleading
3. Assumes all output is sold
Break-even analysis assumes that everything produced is sold with no leftover stock
In reality, some products may not sell, which can make the analysis too optimistic
4. Revenue and costs are not always directly linked to output
The model assumes that costs and revenue change in a straight line as output increases
However, in real life, discounts, bulk purchasing or changing raw material costs can affect this relationship.
5. Requires skill to calculate and interpret correctly
To get useful results, the business must understand how to calculate and read break-even charts and data
If the analysis is done poorly, it can lead to wrong decisions

Unlock more, it's free!
Was this revision note helpful?
