Syllabus Edition
First teaching 2025
First exams 2027
Causes & Consequences of Price Changes (Cambridge (CIE) IGCSE Economics): Revision Note
Exam code: 0455 & 0987
Dynamic markets
Real-world markets are constantly changing and are referred to as dynamic markets
Market equilibrium can change every few minutes in some markets (e.g. stocks and shares), or every few weeks or months in others (e.g. clothing).
Any change to a condition of demand or supply will temporarily create disequilibrium and market forces will then seek to clear the excess demand or supply
Changes to demand that increase price
During lockdowns associated with the Covid-19 pandemic, furniture retailers experienced unexpectedly high demand for their products (especially desks and sofas)

Diagram analysis
Due to the Covid-mandated change of working from home, consumers experienced a temporary change in taste as they sought to set up comfortable home offices
This led to an increase in demand for desks from D1→D2
At the original market clearing price of P1, a condition of excess demand now exists
The demand for desks is greater than the supply
In response, suppliers raise prices to P2
The excess demand is cleared and the new market quantity is Q2
Both the equilibrium price (P2) and the equilibrium quantity (Q2) are higher than before
Changes to supply that increase price
In September 2022, Hurricane Fiona destroyed much of Puerto Rico's crop of plantains (a necessity in the diet of local people)

Diagram analysis
In the aftermath of Hurricane Fiona, Puerto Rico is experiencing a supply shock in its plantain market
This causes a decrease in supply of S1→S2
At the original market clearing price of P1, a condition of excess demand now exists (shortage)
The demand for plantain is greater than the supply
In response, sellers in Puerto Rico raise prices to P2
The equilibrium price (P2) is higher and the equilibrium quantity (Q2) is lower than before
The excess demand in the market has been cleared
Changes to demand that decrease price
Demand for lobsters in Maine, USA has been falling steadily in recent months
This has resulted in a price fall from $12.35 per pound on April 1st to $9.35 per pound on May 1st

Diagram analysis
In recent months, the USA has been experiencing an increasing rate of inflation
Inflation lowers the purchasing power of money in a consumer's pocket and, therefore, effectively reduces their real income
With reduced real income, fewer luxuries are consumed
This led to a decrease in demand for lobsters from D1→D2
At the original market clearing price of P1, a condition of excess supply now exists
The demand for lobsters is less than the supply
In response, suppliers gradually reduce prices to P2
Both the equilibrium price (P2) and the equilibrium quantity (Q2) are lower than before
The excess supply in the market has been cleared
Changes to supply that decrease price
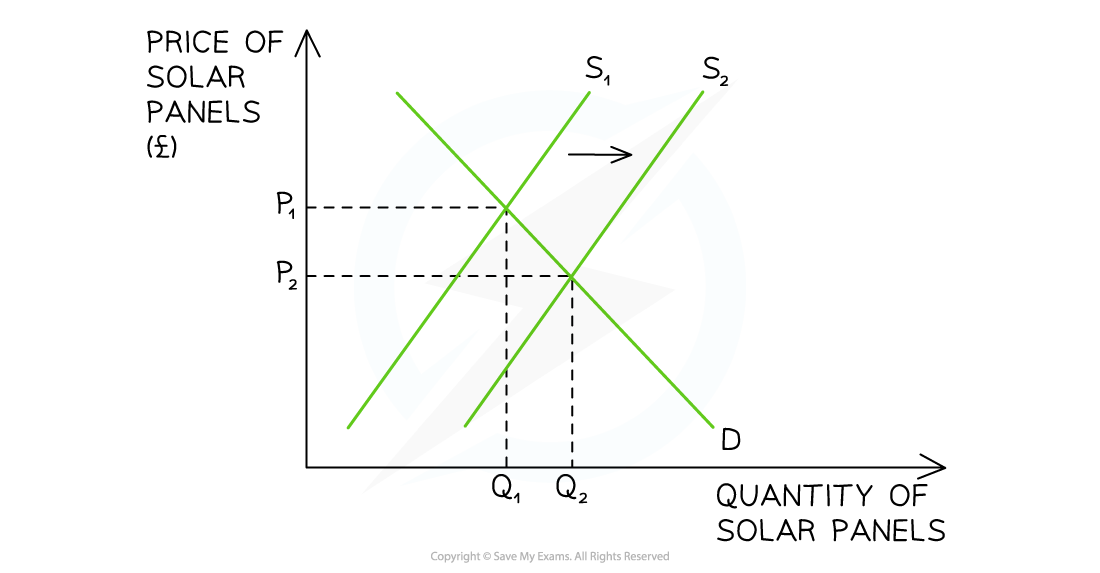
In order to help meet their climate targets and lower energy costs for households, the EU is providing subsidies for solar panels

Diagram analysis
To help meet its climate change targets and lower household energy bills, the EU has provided a subsidy to solar panel retailers
This causes an increase in supply of S1→S2
At the original market clearing price of P1, a condition of excess supply now exists (surplus)
The supply of solar panels is greater than the demand
In response, sellers in the EU lower prices to P2
The equilibrium price (P2) is lower and the equilibrium quantity (Q2) is higher than before
The excess supply in the market has been cleared
The effect of price changes on sales
In any market, changes in price have a direct impact on sales (quantity demanded and quantity supplied).
A rise in price usually leads to a fall in quantity demanded
A fall in price usually leads to a rise in quantity demanded
This is known as the law of demand, and it underpins how prices influence consumer purchasing decisions and firm revenue
If prices rise
Consumers may reduce purchases or switch to cheaper alternatives
Quantity demanded falls, leading to lower sales for firms
For example, when mobile phone prices rose in Egypt due to import taxes, many consumers delayed upgrading, and local sales fell.
Firms may lose market share if competitors keep prices low
If prices fall
Goods become more affordable to a larger number of consumers
Quantity demanded rises, which can increase sales volume
For example, a discount on ride-hailing apps in Mexico City led to a surge in bookings, increasing total sales for the platform
This can benefit firms with price-elastic products
The impact depends on elasticity
Price elasticity of demand (PED) measures how responsive the quantity demanded of a good or service is to a change in its price
The extent of change in sales depends on the price elasticity of demand (PED):
If demand is elastic → a small price drop causes a large increase in sales
If demand is inelastic → a price change has little effect on sales
Read more on price elasticity of demand here

Unlock more, it's free!
Was this revision note helpful?