Syllabus Edition
First teaching 2025
First exams 2027
Solutions to Market Failure: Indirect Taxation & Subsidies (Cambridge (CIE) IGCSE Economics): Revision Note
Exam code: 0455 & 0987
Indirect taxation
An indirect tax is paid on the consumption of goods or services
It is only paid if consumers make a purchase
It is usually levied by the government on demerit goods to reduce the quantity demanded (QD) and/or to raise government revenue
Government revenue is used to fund government provision of goods and services esuch as education
Indirect taxes are levied by the government on producers. This is why the supply curve shifts
Producers and consumers each pay a share (incidence) of the tax
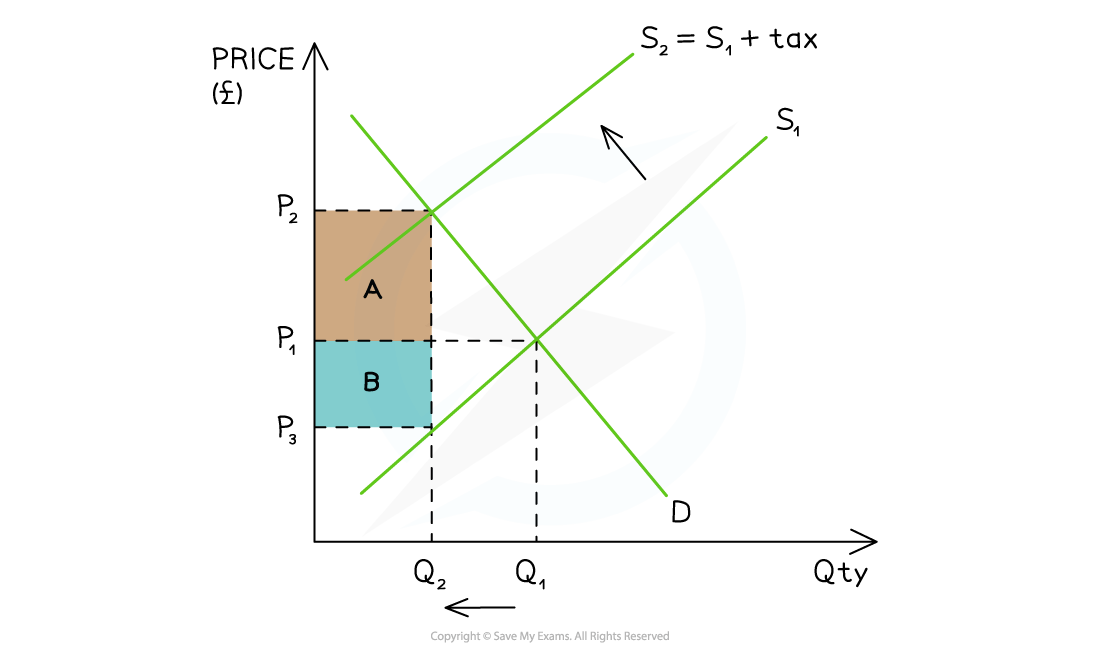
Diagram analysis
The government places a specific tax on a demerit good
The supply curve shifts left from S1 → S2 by the amount of the tax
The price the consumer pays has increased from P1 before the tax, to P2 after the tax
The price the producer receives has decreased from P1 before the tax to P3 after the tax
The government receives tax revenue = (P2 - P3) x Q2
The consumer incidence (share) of the tax is equal to area A: (P2 - P1) x Q2
The producer incidence (share) of the tax is equal to area B: (P1 - P3) x Q2
The QD in this market has decreased from Q1 → Q2
If the decrease in QD is significant enough, it may force producers to lay off some workers
Evaluating the use of indirect taxes to correct market failure
Advantages | Disadvantages |
|---|---|
|
|
Examiner Tips and Tricks
When analysing the impact of taxes on a market, it is worth highlighting the elasticity of the product, as it influences who pays more of the tax (producer or consumer).
The more price inelastic the product, the greater the proportion of the tax that is passed on to consumers by producers, as the quantity demanded will fall less proportionately than the price increase.
The more price elastic the product, the smaller the proportion of the tax that is passed on to consumers by producers, as the quantity demanded will fall more proportionately than the price increase.
Producer subsidies
A producer subsidy is a per unit amount of money given to a firm by the government in order to:
increase production
increase the provision of a merit good
The way a subsidy is shared between producers and consumers is determined by the price elasticity of demand (PED) of the product
Producers keep some of the subsidy and pass the rest on to the consumers in the form of lower prices

Diagram analysis
The original equilibrium is at P1Q1
The subsidy shifts the supply curve from S → S + subsidy:
This increases the QD in the market from Q1 → Q2
The new market equilibrium is P2Q2
This is a lower price and higher QD in the market
Producers receive P2 from the consumer PLUS the subsidy per unit from the government
Producer revenue is therefore P3 x Q2
The producer share of the subsidy is marked B in the diagram
The subsidy decreases the price that consumers pay from P1 → P2
The consumer share of the subsidy is marked A in the diagram
The total cost to the government of the subsidy is (P3 - P2) x Q2 represented by area A+B
Evaluating the use of producer subsidies to correct market failure
Advantages | Disadvantages |
|---|---|
|
|

Unlock more, it's free!
Join the 100,000+ Students that ❤️ Save My Exams
the (exam) results speak for themselves:

Was this revision note helpful?