Enzymes (College Board AP® Biology): Exam Questions

1 hour27 questions
1a
Sme Calculator
2 marks

Amylase is an enzyme that catalyzes the break-down of starch into maltose.

(i) Describe how an enzyme catalyzes a biochemical reaction.

(ii) Explain why enzyme function is affected by pH changes.

1b
Sme Calculator
2 marks

Scientists conducted an experiment to investigate how pH affects the activity of amylase. They measured reaction rates at different pH levels and recorded their findings.

(i) Identify the independent variable in this experiment.

(ii) Justify why the scientists executed the experiment at a controlled temperature of 25 °C.

1c
Sme Calculator
2 marks

Salivary amylase is released into the mouth, and pancreatic amylase is released into the small intestine. A neutral pH is characteristic of both the mouth and the small intestines.

(i) Predict how amylase activity would change if the experiment were repeated at an extremely acidic pH (e.g. pH 2).

(ii) Explain why this change in activity occurs at low pH levels.

1d
Sme Calculator
2 marks

(i) Describe a modification to the experiment that could test the effect of temperature on amylase activity.

(ii) Justify how this modification would provide valid experimental results.

Did this page help you?

2a
Sme Calculator
1 mark

Enzymes are biological catalysts that speed up chemical reactions in cells. The enzyme catalase helps break down a toxic byproduct of metabolic processes called hydrogen peroxide (H₂O₂). This substrate is broken down into water and oxygen in the human body.

Describe the feature of an enzyme that determines its substrate specificity.

2b
Sme Calculator
1 mark

Explain how temperature affects enzyme activity.

2c
Sme Calculator
1 mark

In an investigation, a student measured the rate of catalase activity at different pH levels. The results are see in the table

pH level

Volume of oxygen produced (mL)

4

5.2

7

18.4

10

6.1

State what these results tell you about the optimum pH of catalase.

2d
Sme Calculator
1 mark

Justify why catalaze activity is necessary for preventing cellular damage.

Did this page help you?

3a
Sme Calculator
1 mark

The enzyme amylase catalyzes the breakdown of starch into maltose. A student sets up an experiment to measure amylase activity at different pH levels.

Identify the dependent variable in an experiment measuring enzyme activity at different pH levels.

3b
Sme Calculator
1 mark

Describe the effect of increasing enzyme concentration on reaction rate when excess substrate is present.

3c
Sme Calculator
1 mark

Enzymes act as biological catalysts of reactions by weakening bonds in the substrate and bringing reactants close to one another.

Explain how this increases the rate of reaction.

3d
Sme Calculator
1 mark

Justify why enzymes are essential for energy-efficient metabolism in living organisms.

Did this page help you?

4a
Sme Calculator
1 mark

The drug methotrexate is an enzyme inhibitor used to interfere with DNA synthesis in cancer cells. Methotrexate is an example of a competitive inhibitor.

Identify the region of the enzyme to which methotrexate is most likely to bind.

4b
Sme Calculator
1 mark

Describe how a noncompetitive inhibitor affects enzyme activity.

4c
Sme Calculator
1 mark

Explain how enzyme activity would change if a strong, irreversible competitive inhibitor were introduced into a reaction.

4d
Sme Calculator
1 mark

Justify why increasing substrate concentration reduces the effect of a competitive inhibitor.

Did this page help you?

1a4 marks

An experiment was conducted to measure the reaction rate of the human salivary enzyme α-amylase. Ten mL of a concentrated starch solution and 1.0 mL of α-amylase solution were placed in a test tube. The test tube was inverted several times to mix the solution and then incubated at 25°C. The amount of product (maltose) present was measured every 10 minutes for an hour. The results are given in the table below.

Time (minutes) 

Maltose Concentration (μM)

0

0

10

5.1

20

8.6

30

10.4

40

11.1

50

11.2

60

11.5

Construct a graph for this data on the axes provided and calculate the rate of the reaction for the time period 0 to 30 minutes. 

1b2 marks

Explain why a change in the reaction rate was observed after 30 minutes. 

1c2 marks

Draw and label another line on the graph to predict the results if the concentration of α-amylase was doubled. Explain your predicted results. 

1d4 marks

Identify two environmental factors that can change the rate of an enzyme-mediated reaction. Discuss how each of those two factors would affect the reaction rate of an enzyme. 

Did this page help you?

2a1 mark

Fireflies emit light when the enzyme luciferase catalyzes a reaction in which its substrate, D-luciferin, reacts to form oxyluciferin and other products (Figure 1). In order to determine the optimal temperature for this enzyme, scientists added ATP to a solution containing D-luciferin, luciferase, and other substances needed for the reaction. They then measured the amount of light emitted during the first three seconds of the reaction when it was carried out at different temperatures.

D-Luciferin + O2 + ATP rightwards arrow with Lucifefase on top Oxyluciferin + CO2 + AMP + PPi + Light

Figure 1. Light is emitted as a result of the reaction catalyzed by luciferase.

Describe a characteristic of the luciferase enzyme that allows it to catalyze the reaction.

2b1 mark

Identify the dependent variable in the experiment.

2c1 mark

State the null hypothesis for the experiment.

2d1 mark

A student claims that, as temperature increases, there will be an increase in the amount of light given off by the reaction in the first three seconds. Support the student's claim.

Did this page help you?

3a
Sme Calculator
1 mark

Researchers investigated the activity of the enzyme lactase, which breaks down lactose into glucose and galactose. They measured reaction rates at different substrate concentrations and recorded mean values with standard errors, as shown in Figure 1 below:

Graph showing enzyme activity vs substrate concentration. The reaction rate increases from 2 to 10 with rising substrate concentration from 0.5 to 4 mM.
Figure 1. A graph showing how the increase in substrate concentration affects the reaction rate of Lactase enzyme.

Using the data in Figure 1, describe the effect of substrate concentration on lactase activity.

3b
Sme Calculator
1 mark

With reference to the data in Figure 1, justify why the reaction rate does not increase indefinitely as substrate concentration rises.

3c
Sme Calculator
1 mark

The researchers claim that increasing substrate concentration from 3.0 mM to 4.0 mM does not significantly increase reaction rate.

Provide evidence, from Figure 1, to support this claim.

3d
Sme Calculator
1 mark

Lactose intolerance is caused by insufficient levels of the enzyme lactase. When undigested lactose reaches the large intestine, gut bacteria ferment it, producing gases, such as hydrogen, methane, and carbon dioxide. This results in flatulence and bloating.

Using the data provided in Figure 1, explain how a lactase deficiency can lead to the symptoms observed in individuals with lactose intolerance.

Did this page help you?

4a
Sme Calculator
1 mark

A team of scientists studied the effect of pH on the activity of trypsin, a protease enzyme that catalyzes the breakdown of protein in the small intestine. They compared the activity of the wild-type enzyme to a mutant version of the enzyme, which contained a nucleotide base substitution in its active site. The scientists measured reaction rates (μmol product/min) for both enzyme variants at different pH levels and recorded their findings, including standard error values to account for variability.

Graph showing effect of mutation on enzyme activity across pH levels. Wild-type peaks at pH 6, mutant at pH 5. Reaction rates decrease after peak.
Figure 1. Graph showing the affect of pH in mutant and wildtype enzymes

Describe how mutations can affect enzyme specificity.

4b
Sme Calculator
1 mark

Using the data in Figure 1, describe how the enzyme activity has changed due to the mutation.

4c
Sme Calculator
1 mark

Predict how the mutation is likely to affect protein digestion in the small intestine.

4d
Sme Calculator
1 mark

Give reasons to justify your answer to part (c).

Did this page help you?

1a
Sme Calculator
1 mark

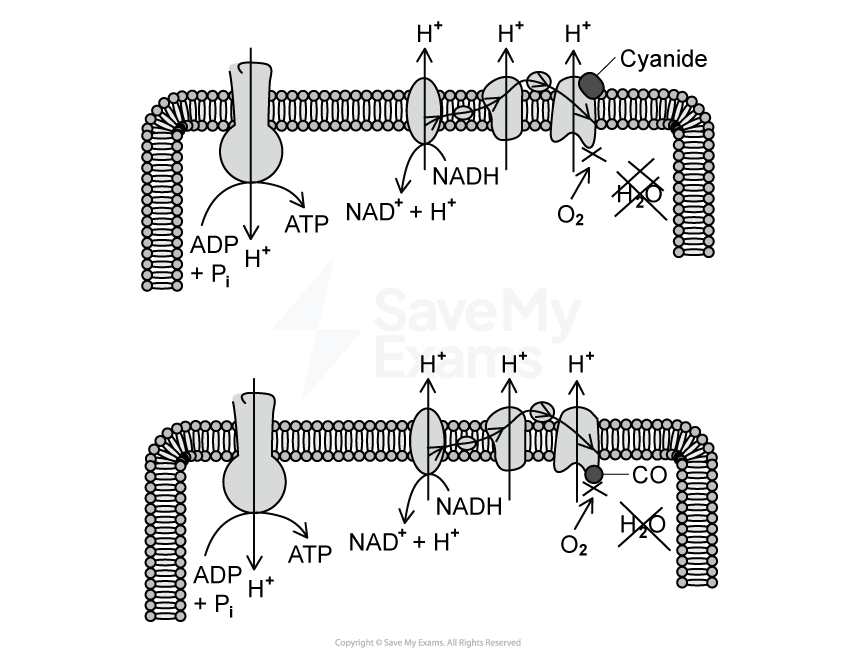
A team of scientists studied the effects of toxic compounds, cyanide and carbon monoxide (CO) on cellular respiration.

Both substances negatively affect the activity of cytochrome c oxidase, a key enzyme in the electron transport chain of cellular respiration. The interaction between both inhibitors and cytochrome C is represented in Figure 1.

Diagram of the electron transport chain affected by cyanide (top) and carbon monoxide (bottom), showing ATP production, NADH oxidation, and blocked O₂ reduction.
Figure 1. The interaction of cytochrome oxidase with cyanide, on the left, and carbon monoxide (CO) , on the right.

To investigate their impact, the scientists measured enzyme activity under control conditions (no inhibitor), in the presence of carbon monoxide, and in the presence of cyanide across varying substrate concentrations. Figure 2 shows the results of the investigation.

Graph showing enzyme activity vs oxygen concentration with three lines: control (highest activity), carbon monoxide, and cyanide (lowest activity).
Figure 2. Graph to show the effect of cyanide and carbon monoxide on cytochrome C Oxidase Activity

Describe the role of oxygen in ATP production in eukaryotic cells.

1b
Sme Calculator
1 mark

Based on Figures 1 and 2, explain why an increase in oxygen concentration after 2 mM, does not result in an increase in ATP production in the presence of cyanide.

1c
Sme Calculator
1 mark

Predict what would happen to the oxygen consumption rate and ATP synthesis if the concentration of carbon monoxide were doubled, based on the data.

1d
Sme Calculator
1 mark

Justify your prediction with reference to the proton gradient and activity of ATP synthase.

Did this page help you?

2a
Sme Calculator
1 mark

A scientist is studying phosphofructokinase (PFK), a key enzyme in glycolysis that catalyzes the conversion of fructose-6-phosphate into fructose-1,6-bisphosphate using ATP. The scientist is investigating how two inhibitors, X and Y, affect the activity of PFK under different conditions.

Describe how ATP production in anaerobic and aerobic respiration relies on PFK.

2b
Sme Calculator
1 mark

The scientist measured the reaction rate (μmol ATP/min) of PFK under different conditions and recorded the data in Table 1.

Table 1: Effect of inhibitors on PFK activity

Condition

Reaction rate (μmol ATP/min)

No inhibitor

12.5

With inhibitor X (1 mM)

6.3

With inhibitor Y (1 mM)

4.1

With inhibitor X + more substrate

11.8

With inhibitor Y + more substrate

4.0

Justify which inhibitor (X or Y) is most likely a competitive inhibitor, using the data in Table 1.

2c
Sme Calculator
1 mark

ATP can act as a non-competitive inhibitor of PFK. This is a key rate-limiting step in the pathway as it is regulated by levels of ATP.

Predict how ATP production would be impacted if ADP levels increased.

2d
Sme Calculator
1 mark

Give reasoning to justify your prediction.

Did this page help you?

3a
Sme Calculator
2 marks

A team of scientists studied the role of DNA polymerases and exonucleases in DNA replication. DNA polymerases are enzymes essential for accurate DNA synthesis, and exonucleases provide proofreading activity to correct errors during replication.

The scientists compared the accuracy and efficiency of three different DNA polymerases:

  • Polymerase A (lacks exonuclease activity).

  • Polymerase B (possesses exonuclease activity).

  • Polymerase C (high-accuracy polymerase with exonuclease activity).

They measured the rate of DNA synthesis (nucleotides per second) and mutation frequency (errors per million base pairs) across the three enzymes. The data are provided in Table 1.

Table 1: DNA replication efficiency and accuracy in different polymerases

Polymerase type

Replication rate (nt/sec)

Error rate (mutations per million bp)

Polymerase A (No exonuclease)

800

5.2

Polymerase B (exonuclease)

600

0.7

Polymerase C (High-fidelity)

500

0.1

(i) Describe the role of DNA polymerases in DNA replication.

(ii) Explain how complementary base pairing contributes to the accuracy of DNA replication.

3b
Sme Calculator
2 marks

In a follow-up investigation, the scientists studied how the accuracy of DNA replication changed with more complex templates. They measured the replication accuracy based on the percentage of nucleotide bases correctly incorporated into the new strand of DNA. Figure 1 illustrates the effect of template complexity on DNA replication accuracy for different DNA polymerases:

Graph showing the effect of template complexity on DNA replication accuracy. Three lines represent polymerases A, B, and C with varying accuracies.
Figure 1. Graph to show how the complexity of the DNA template affects the accuracy of DNA replication.

(i) Identify the dependent variable in the follow-up investigation.

(ii) Justify the control group used by the scientists.

3c
Sme Calculator
3 marks

(i) Based on the data in Figure 1 and Table 1, describe the relationship between the accuracy of DNA replication and the presence of exonucleases.

(ii) One set of chromosomes in a human cell contains 3 billion base pairs. The scientists calculated that during replication with polymerase C, there would be an estimated 600 mutations.

Using the data in Table 1, calculate how many more mutations are estimated to occur during replication by polymerase A compared to polymerase C in a diploid cell.

3d
Sme Calculator
2 marks

(i) Predict how increasing the complexity of the DNA template would affect both the replication rate and error frequency of the three polymerases.

(ii) Use the trends shown in Table 1 and Figure 1 to justify your prediction.

Did this page help you?

4a1 mark

Figure 1 shows the initial stage in glycolysis involving the conversion of glucose to glucose-6-phosphate, catalyzed by hexokinase enzyme.

Diagram showing glucose converting to glucose 6-phosphate (G6P). ATP to ADP, catalysed by hexokinase, adds a phosphate group to glucose.
Figure 1. Phosphorylation of glucose using hexokinase enzyme.

With reference to Figure 1, describe the role of hexokinase as a catalyst.

4b1 mark

Based on Figure 1, explain the role of hexokinase in the production of ATP.

4c1 mark

Phosphorylation of glucose by hexokinase is an exergonic reaction, meaning there is a net release of energy during the process. Figure 2 represents the energy profiles for two different types of reaction.

Graph of reaction progress with energy on y-axis. Two peaks represent transition states with reactants (R) and products (P) labelled on the path.
Figure 2. Energy profiles for two different types of reaction.

On the template provided, draw an X to indicate which line best represents the energy profile of this reaction.

4d1 mark

Hexokinase is regulated through feedback inhibition where glucose 6-phosphate will compete with glucose for substrate binding.

With reference to Figure 1, explain why this is possible.

Did this page help you?