14 marks
Fig. 3.2 shows the effect of pH on enzyme activity.
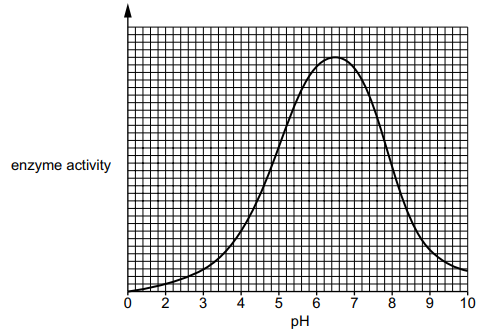
Fig. 3.2
(i) The enzyme in Fig. 3.2 is active in the mouth.
When the enzyme reaches the stomach, the enzyme activity changes.
Explain why the enzyme activity changes.
[3]
(ii) Draw a curve on Fig. 3.2 to show the activity of a protease enzyme found in the stomach.
[1]
Was this exam question helpful?