Hardy-Weinberg Equilibrium (College Board AP® Biology): Revision Note

Conditions for Hardy-Weinberg equilibrium
The Hardy-Weinberg principle states that, if certain conditions are met, then the allele frequencies of a gene within a population will not change from one generation to the next
The Hardy-Weinberg equation allows for the calculation of allele and genotype frequencies within populations
It also allows for predictions to be made about how these frequencies will change in future generations
Conditions that must be met for the Hardy-Weinberg principle to hold true include:
a large population size
no migration into or out of the population
no mutations give rise to new alleles
mating is random
natural selection is not acting on the population
The assumptions listed are very rarely, if ever, all present in nature
Despite this, the Hardy-Weinberg equilibrium concept can provide a useful null hypothesis when evaluating the effects of genetic changes
The Hardy-Weinberg equation
If the phenotype of a trait in a population is determined by a single gene with only two alleles (we will use B / b as examples throughout this section), then the population will consist of individuals with three possible genotypes:
Homozygous dominant (BB)
Heterozygous (Bb)
Homozygous recessive (bb)
When using the Hardy-Weinberg equation, frequencies are expressed as a proportion of the population, e.g.:
if every individual in the population has the homozygous dominant genotype (BB), its frequency will be 1
if half of the population show this genotype, then the frequency will be 0.5
Allele frequencies
For a gene with two alleles (B and b):
The letter p represents the frequency of the dominant allele (B)
The letter q represents the frequency of the recessive allele (b)
As there are only two alleles for this gene:
p + q = 1
For example:
in a population of 100 individuals, there are 200 alleles
if there are 120 dominant (B) alleles, the frequency of the dominant allele = 120/200
therefore:
p = 120 ÷ 200 = 0.6
q = 1 - 0.6 = 0.4
Genotype frequencies
Frequency of genotypes can also be represented; this is the proportion of all of the individuals with a particular genotype
For a gene with two alleles (B and b):
the homozygous dominant (BB) genotype is represented by p2
the heterozygous genotype (Bb) is represented by 2pq
the homozygous recessive genotype (bb) is represented by q2
As these are all the possible genotypes of individuals in the population, the following equation can be constructed:
p2 + q2 + 2pq = 1
Worked Example
In a population of birds 10% of the individuals exhibit the recessive phenotype of white feathers.
Using F / f to represent dominant and recessive alleles for feather color, calculate the frequencies of all genotypes.
Answer:
Step 1: determine which part of the equation we have been given, and which part(s) we need to work out
Those with the recessive phenotype must have the homozygous recessive genotype, so 10% of the population has the genotype ff
The homozygous recessive genotype is represented by q2, therefore:
q2 = 10% = 0.1
We have been asked to calculate all of the genotype frequencies, so we also need to calculate the frequencies for homozygous dominant ( p2 ) and heterozygous ( 2pq )
Step 2: find q
q = ![]() = 0.32
= 0.32
Step 3: find p
p + q = 1
p = 1 - 0.32
p = 0.68
Step 4: find p2
0.682 = 0.46
p2 = 0.46
Step 5: find 2pq
2 x (0.68) x (0.32) = 0.44
In summary:
Allele frequencies:
p = frequency of F allele = 0.68
q = frequency of f allele = 0.32
Genotype frequencies:
p2 = frequency of FF genotype = 0.46
q2 = frequency of ff genotype = 0.10
2pq = frequency of Ff genotype = 0.44
Worked Example
Figure 1 shows changes in allele frequencies in two populations of beetles (X and Y) over 10 generations.
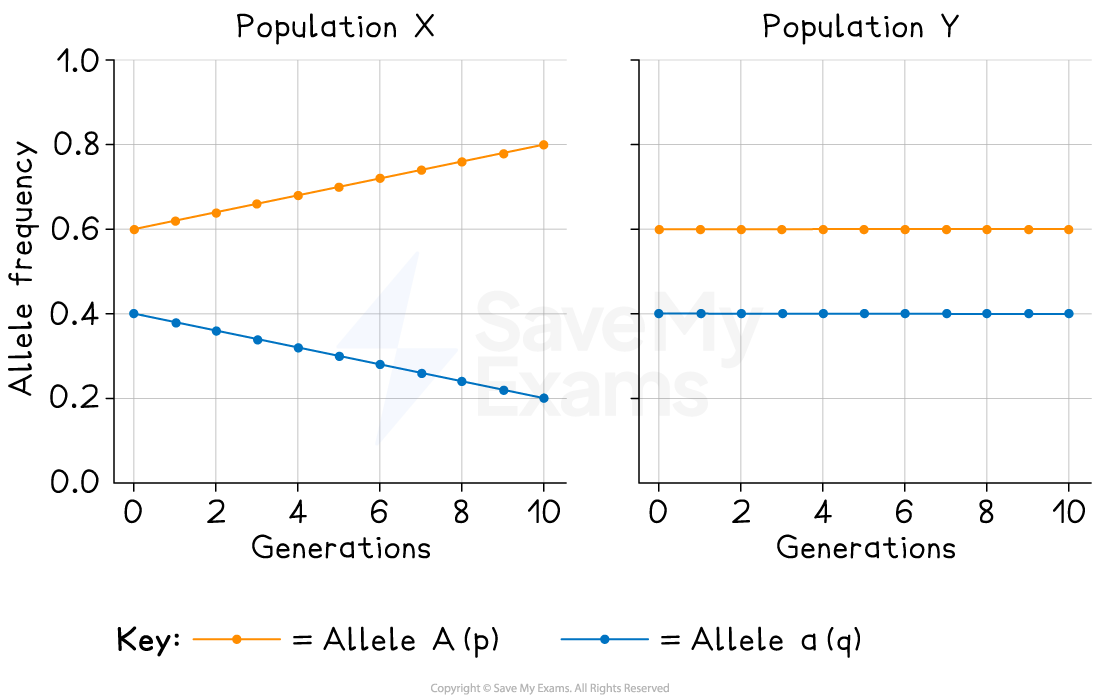
Use the data in Figure 1 to determine whether or not evolution is taking place in each population.
[1]
Answer:
Evolution is taking place in population X AND not in population Y; [1 point]
Population X:
Allele A (p) increases while allele a (q) decreases over generations
Changes in allele frequencies provide evidence for the occurrence of evolution in a population
The population is not in Hardy–Weinberg equilibrium
Population Y:
Allele frequencies remain constant (p = 0.6, q = 0.4) across generations
The allele frequencies stay the same over time so evolution is not occurring
Examiner Tips and Tricks
When you are using Hardy-Weinberg equations you must always start your calculations by determining the proportion of individuals that display the recessive phenotype; this is the only phenotype from which you can immediately work out its genotype as it will always be homozygous recessive.

Unlock more, it's free!
Join the 100,000+ Students that ❤️ Save My Exams
the (exam) results speak for themselves:

Was this revision note helpful?
Build on this topic
