Soil Composition & Properties (College Board AP® Environmental Science): Study Guide

Soil water holding capacity
What is soil water holding capacity?
Soil water holding capacity refers to the total amount of water that soil can retain and make available to plants
Affects plant growth, land productivity, and soil fertility
Factors influencing water holding capacity
Soil texture
Sandy soils: Low water retention due to large particle size and high drainage
Clay soils: High water retention but poor drainage due to small particles
Loamy soils: Balanced water retention and drainage, ideal for agriculture
Organic matter
Increases soil’s ability to hold moisture by improving structure
Example: Soils rich in humus retain more water and nutrients
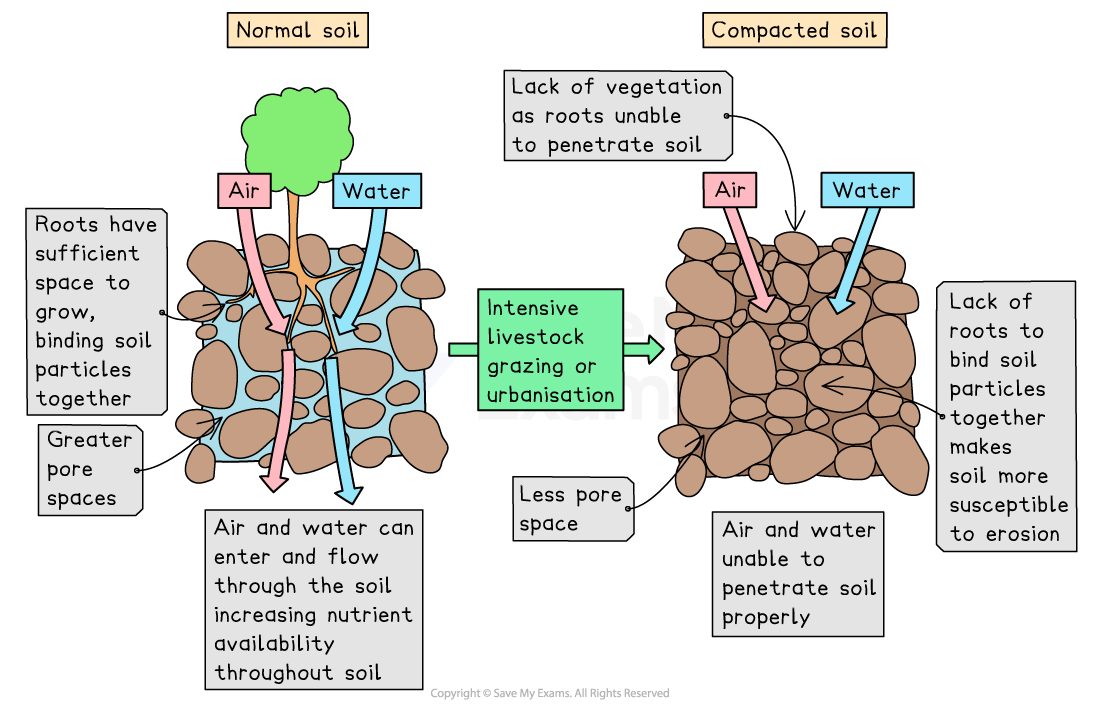
Soil compaction
Compacted soil reduces pore space, decreasing water infiltration and retention
Example: Overgrazed land often has poor water-holding capacity due to soil compaction
Soil particle size & composition
What is soil particle size & composition?
Soil particle size refers to the relative proportions of sand, silt, and clay in soil
Soil composition affects soil texture, porosity, permeability, and fertility
Types of soil particles
Sand
Largest particles with high permeability and low water retention
Drains quickly, making it prone to drought conditions
Example: Sandy soils are common in deserts and coastal regions
Silt
Medium-sized particles that retain moisture better than sand
Smooth texture, often found in floodplains and river valleys
Example: Silt-rich soils are highly fertile and used for agriculture
Clay
Smallest particles with low permeability and high water retention
Drains slowly but holds nutrients well
Example: Clay soils are found in wetland areas and often require aeration for crop growth
Importance of soil composition
Determines water movement and aeration in soil
Affects plant nutrient availability and soil structure
Testing soil properties
Why test soil properties?
Soil testing helps determine chemical, physical, and biological characteristics
Provides information for irrigation, fertilizer application, and land management
Methods of testing soil properties
Chemical testing
pH testing: Determines soil acidity or alkalinity
pH can affect nutrient availability
Nutrient analysis: Measures levels of nitrogen (N), phosphorus (P), and potassium (K)
Salinity testing: Identifies salt concentration, which can impact plant growth
Physical testing
Permeability test: Measures how quickly water drains through soil
Bulk density test: Assesses soil compaction and porosity
Soil texture test: Determines sand, silt, and clay proportions
One type of soil texture test involves the following steps:
The laboratory test involves mixing soil with water and allowing it to settle into distinct layers
This method provides a clear visual representation of the proportions of sand, silt and clay
Any large debris like rocks, roots, or organic matter, are first removed from the sample
The sample is added to a transparent container
Water is added and the container is shaken vigorously
The container is left on a flat surface and left undisturbed (e.g. for 24 hours)
Silt settles first, then clay, and finally sand
The thickness of these layers can be measured to determine their proportions
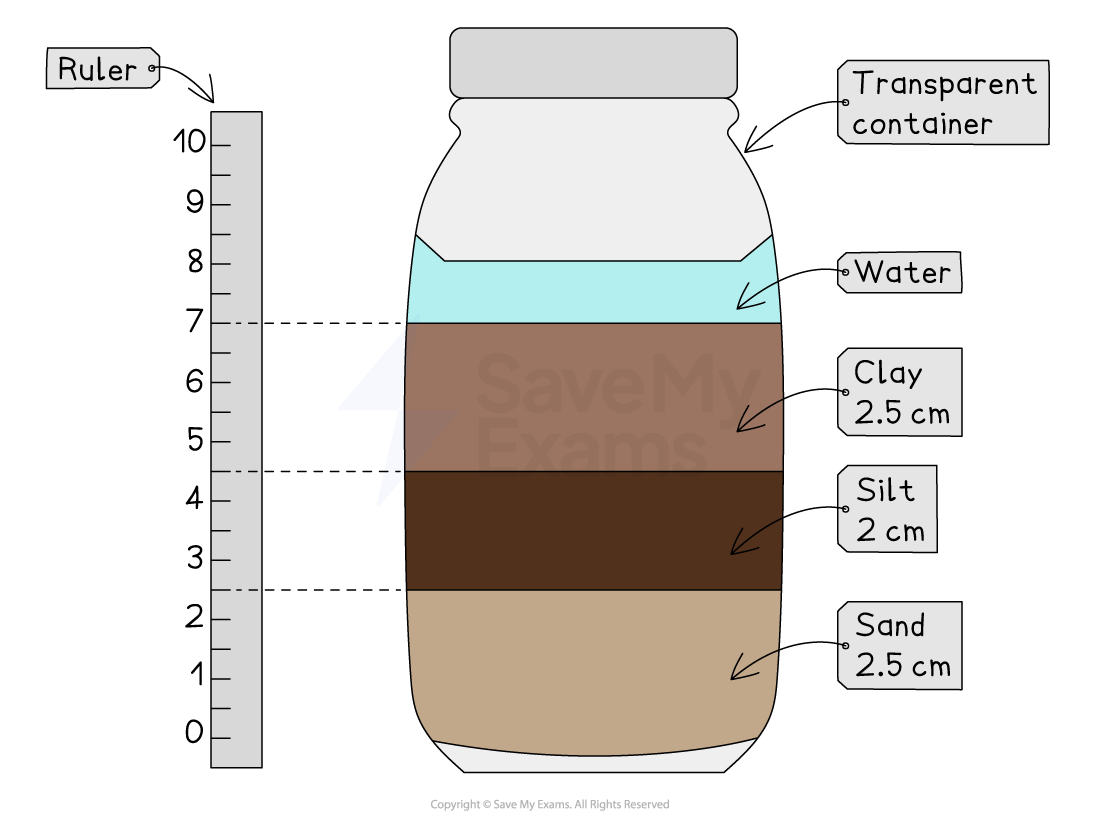
After shaking, soil components settle at different speeds, leading to clear layers that can be measured
Biological testing
Microbial activity test: Evaluates the presence of beneficial microbes for soil health
Organic matter test: Measures decomposed plant and animal material, influencing fertility
Soil texture triangles
What is a soil texture triangle?
A soil texture triangle is a diagram used to classify soil types based on their proportion of sand, silt, and clay
Helps determine soil properties such as drainage, aeration, and fertility
How to use a soil texture triangle
The three side of the triangle represent the proportions of the different soil particle sizes: sand, silt, and clay
Locate the percentage of sand, silt, and clay on the diagram
Follow the lines corresponding to each percentage until they intersect
The intersection point determines the soil classification (e.g., loam, sandy clay, silty clay)

Worked Example
A soil sample is found to contain 50% sand, 20% silt and 30% clay. Using the soil texture triangle, determine the textural class of the soil that the sample was taken from.
Answer
The textural class of the soil that this sample was taken from is sandy clay loam.

Importance of soil texture classification
Affects water retention and drainage:
Sandy soils drain quickly, while clay-rich soils retain more water
Influences agricultural productivity:
Loamy soils are ideal for farming due to balanced properties
Determines soil management strategies:
Helps farmers and environmentalists choose appropriate irrigation and fertilization techniques
Examiner Tips and Tricks
Triangular soil texture graphs are often read incorrectly. Remember—the sum of the percentages must add up to 100%, so always check this. The diagram above shows how to correctly read off percentages for clay, silt, and sand from each of the three axes.

Unlock more, it's free!
Did this page help you?
