Global Climate Change (College Board AP® Environmental Science): Study Guide

Long-term climate change
Climate change is large-scale, long-term changes in average temperatures and weather patterns
Global climates have always varied between warm and cold periods
The last 2.6 million years (the Quaternary period) has seen 60 cold intervals and warmer interglacial periods
The last ice age ended approximately 11,700 years ago
Historical climate

As well as the historical changes in climate, average temperatures have increased annually since the 1980s

Future temperatures?
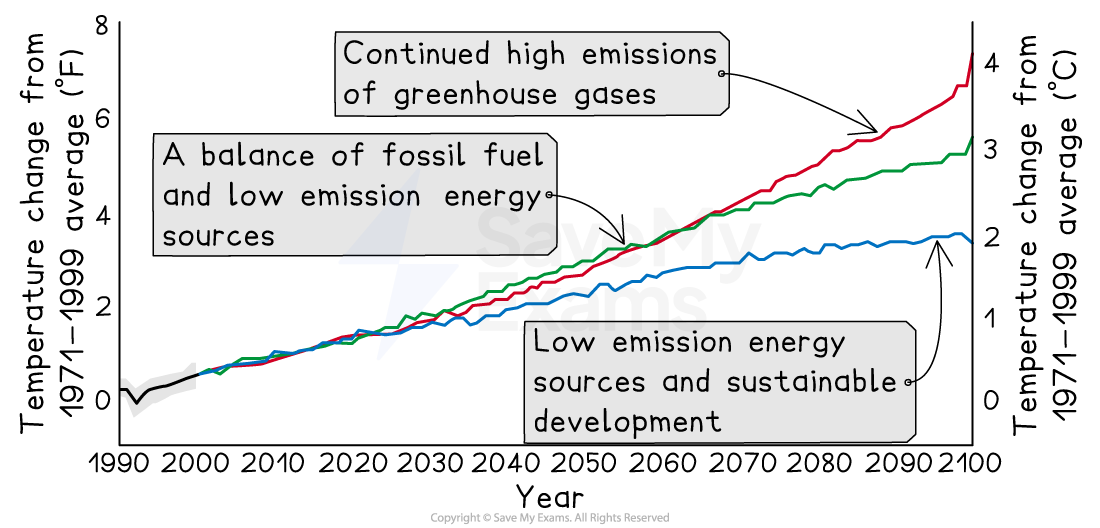
Predictions have been made regarding global temperature in the future based on computer modelling of emissions
The predictions suggest an increase of between 1.9° and 4.2°C
This is dependent on whether the human population continues to
grow at the same rate
use fossil fuels at the same rate
What causes the climate to change?
Atmospheric dust
Large meteorite impacts throw dust up into the atmosphere, which reduces insolation to the Earth's surface.
Reduced insolation cools both air and the surface, thereby producing winter-like conditions across the planet
Plant growth is severely affected, and food crops could fail
Example: A meteorite strike at the end of the Mesozoic Era, 65 million years ago, is thought to have been responsible for the mass extinction of almost half the species alive at the time, including the dinosaurs
Volcanic eruptions
Large-scale eruptions lead to large volumes of sulphur dioxide (SO₂), water vapor, dust, and ash being ejected into the atmosphere
The gases and dust particles in the stratosphere reflect some of the insolation, leading to cooling
The cooling effect can last for months to years depending on the eruption
The 1991 eruption of Mount Pinatubo, Philippines, led to a 10% reduction in sunlight and global temperatures dropped by 0.5°C in 1992
Intense volcanism during Earth's history has significantly increased the amount of carbon dioxide and water vapor in the atmosphere, leading to a warming of the climate
Earth's orbital changes
The Milankovitch cycles illustrate how variations in Earth's long-term orbit and position affect temperature over thousands of years
In the 1920s, Milutin Milankovitch proposed that Earth's eccentricity, tilt, and wobble affected solar radiation and climatic trends
Every 100,000 years, Earth's orbit changes from cool circular periods to elliptical warm periods
The Earth's tilt varies over 40,000 years and the greater the tilt, the hotter summers are and colder the winters are
Every 24,000 years, the Earth wobbles on its axis and this affects seasonal temperatures

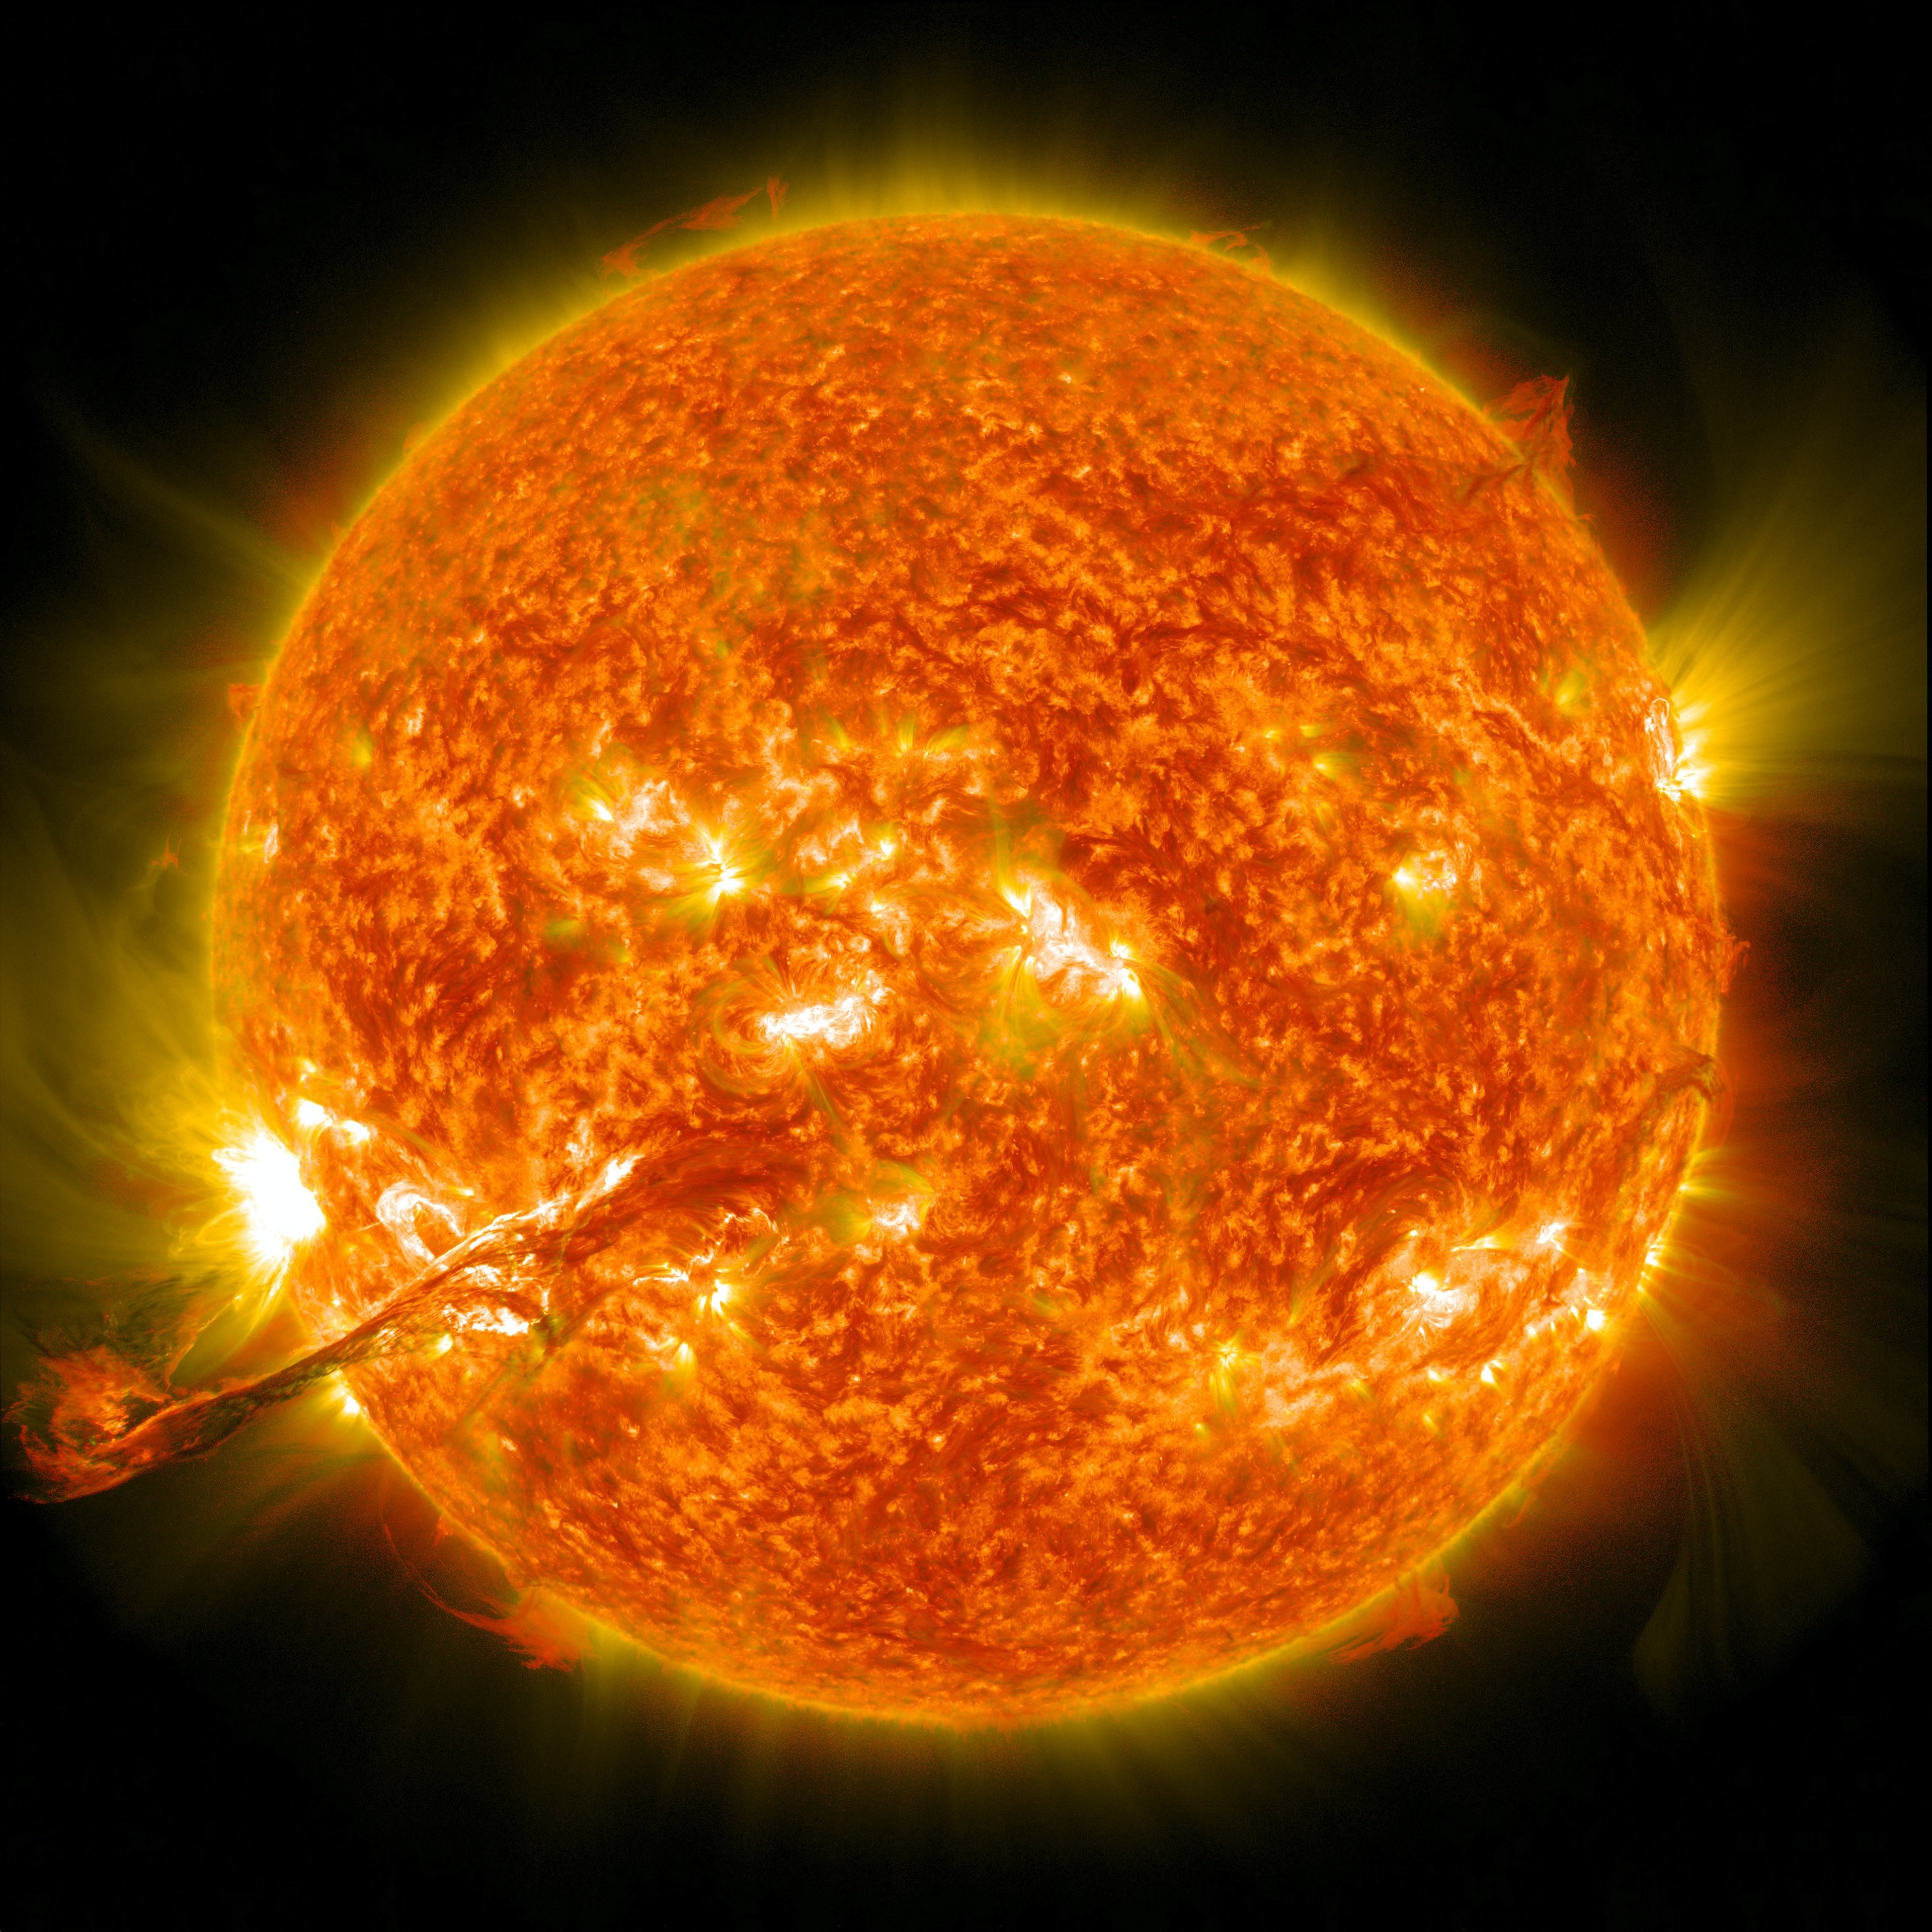
Sunspots and solar flares
The sun goes through 11-year cycles of solar activity
A solar maximum is the time in the cycle when the sun is emitting the most energy and has the most sunspots
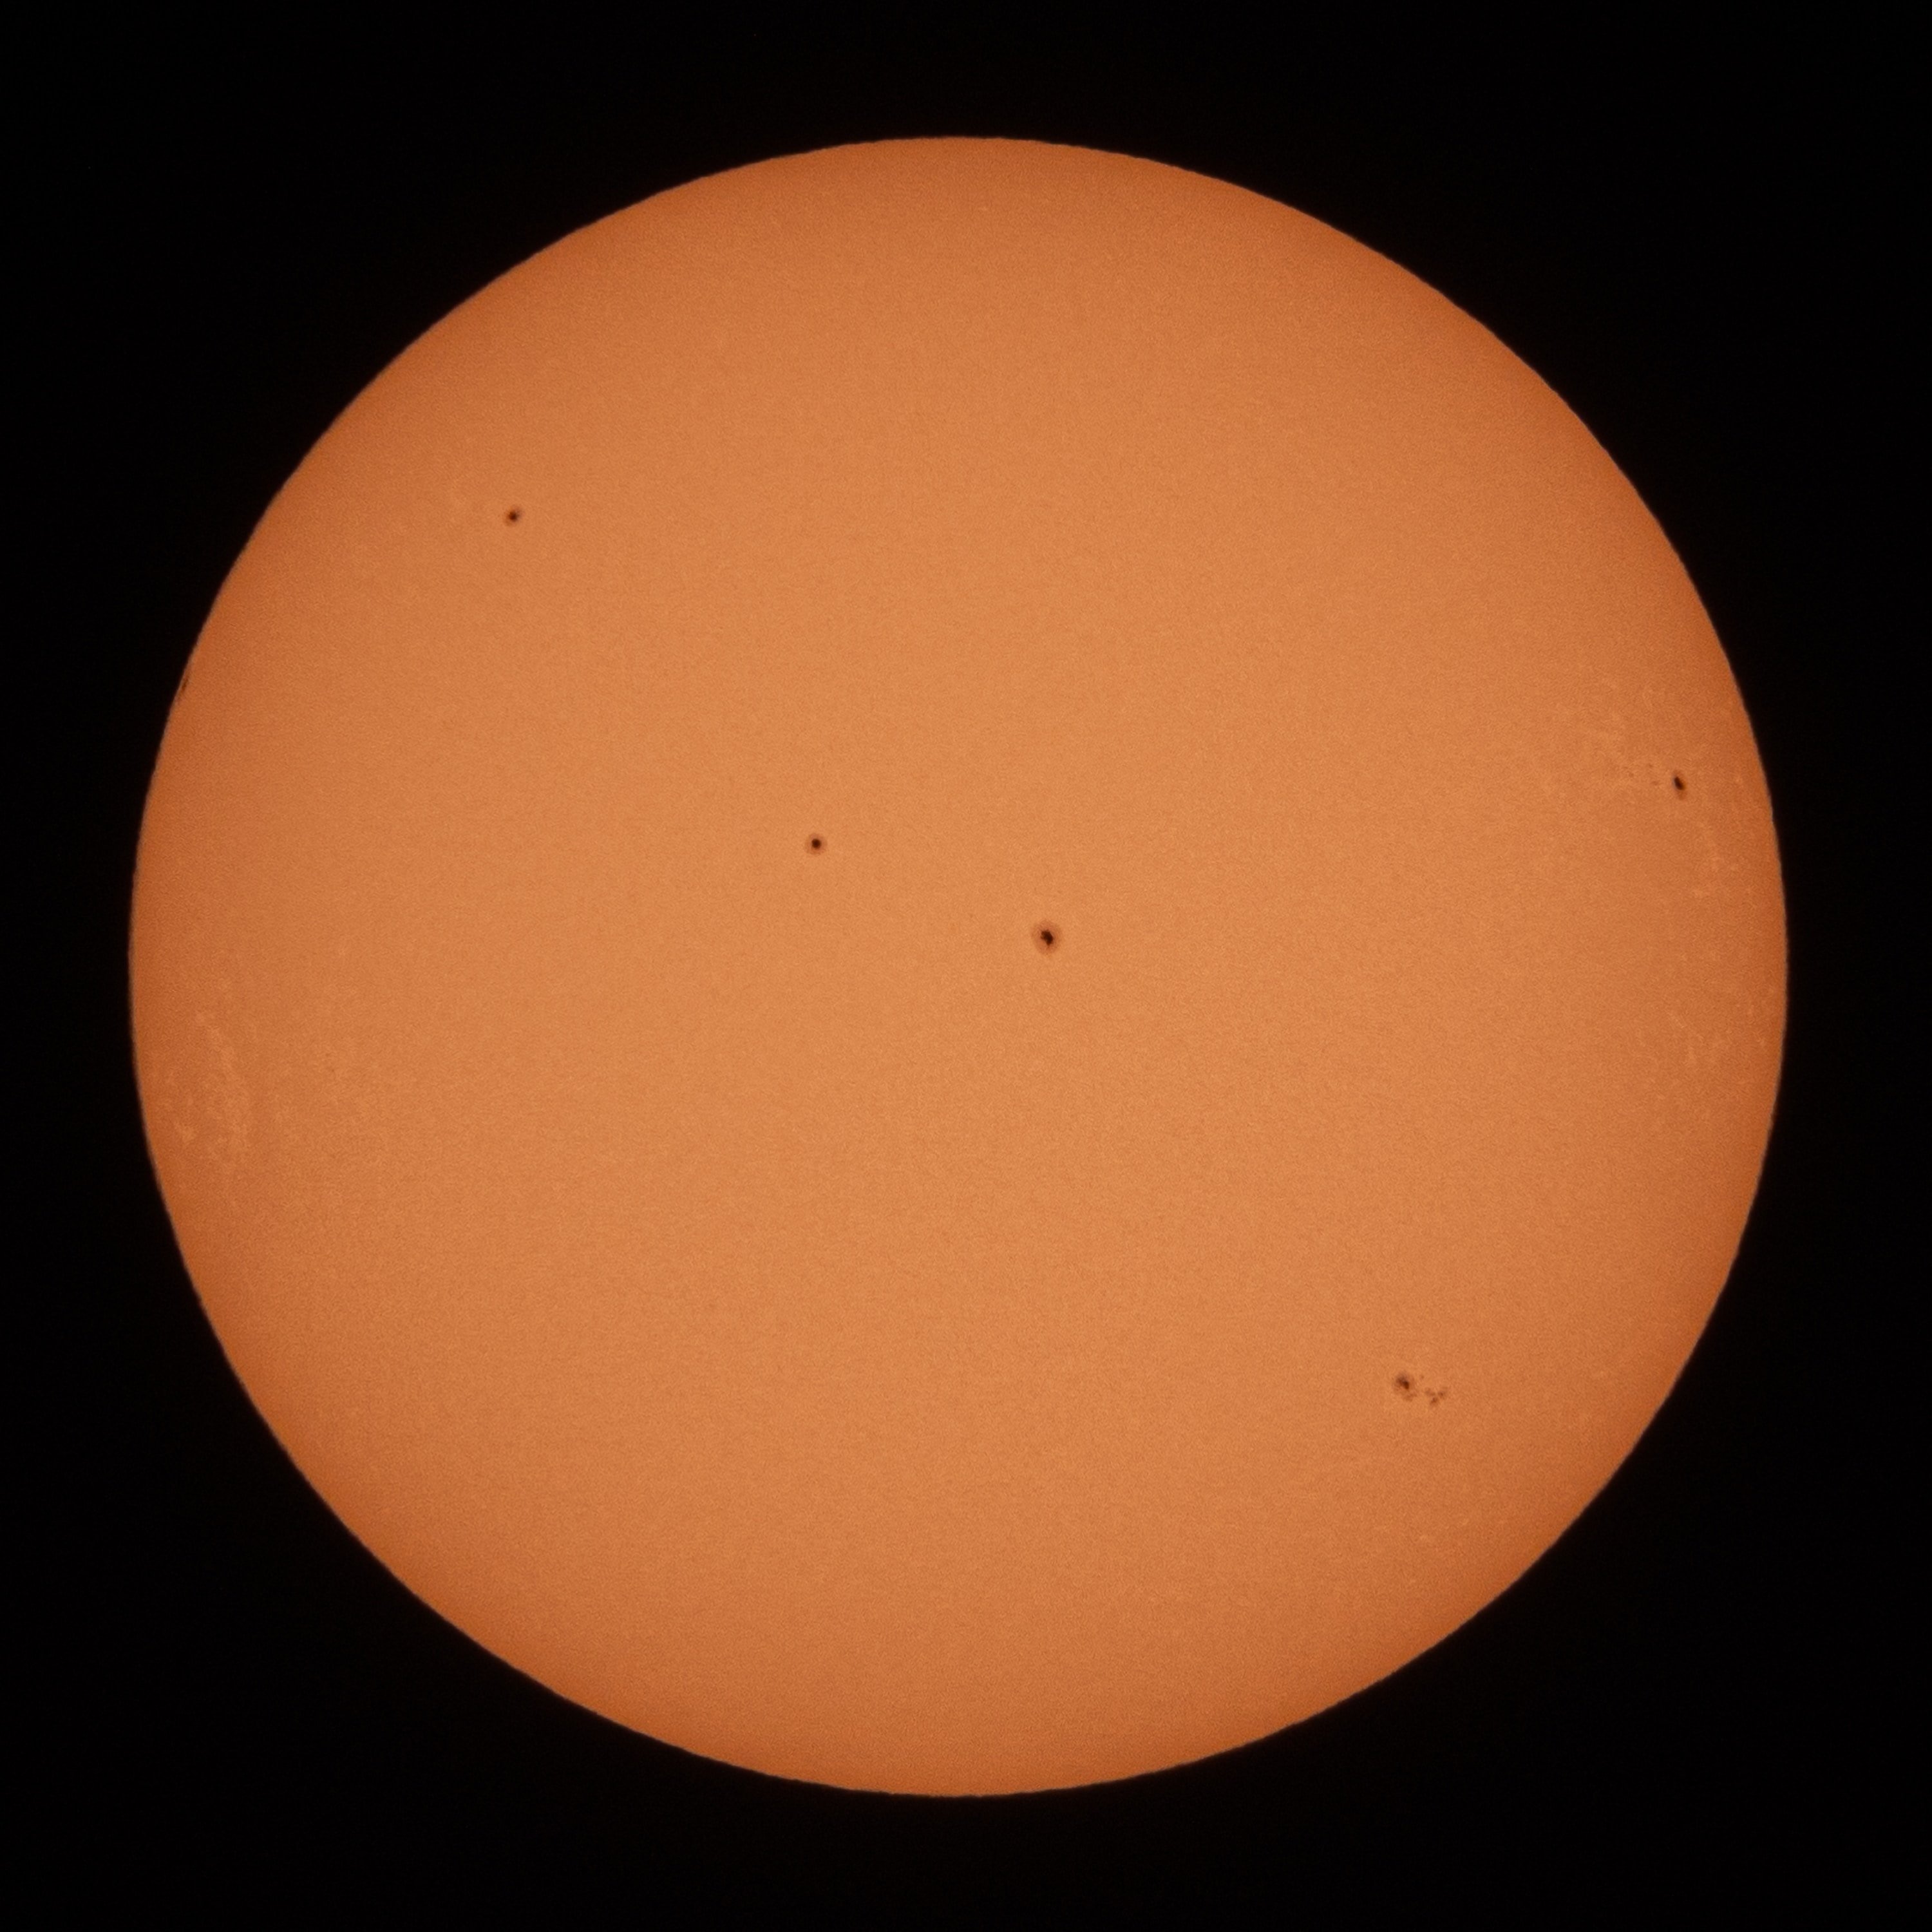
Sunspots are regions of intense and complicated magnetic fields that can produce solar flares
Sunspots range from Earth-size 'pimples' to swollen scars halfway across the sun's surface
Increased sunspot activity is linked to higher average temperatures
Evidence of climate change
The evidence for climate change comes from a range of sources
Ice cores
These trap ash, air bubbles, and microbes
The air bubbles contain CO₂, providing information about past temperatures
Ice cores give information regarding the climate for the last 2.6 million years

Sediments
Deposits in lakes and oceans contain remains of organisms sensitive to environmental changes
These provide indirect evidence of past climates
Preserved pollen
Sediment cores taken from peat bogs and lake beds may contain preserved pollen
Allows scientists to determine the climate conditions necessary for growth of a plant

Historical sources
Historical paintings, books, newspapers and diaries provide evidence of what the climate used to be like
These can be subjective and so may be inaccurate

Tree rings
Trees form annual rings with varying widths based on climate conditions
Thicker rings indicate favourable (warmer) conditions, potentially linked to higher carbon dioxide levels
Analysis of the width of tree rings can provide a measure of climate during each year of growth
Taking cores from the trunks of older trees can provide samples that go back over hundreds of years

Correlation between carbon dioxide and global temperatures
Research using data from these sources shows a clear positive correlation between atmospheric carbon dioxide concentrations and global temperatures
Carbon dioxide levels: as industrial activities have increased, so have atmospheric carbon dioxide levels
Temperature records: proxy data from ice cores, tree rings and other sources indicates that periods with higher carbon dioxide concentrations correspond to warmer global temperatures
Modern instrumental records: direct measurements since the mid-20th century confirm a sharp rise in temperatures, aligning with increased emissions
Since the Industrial Revolution, atmospheric carbon dioxide levels have risen to their highest in Earth's history
Before, the highest atmospheric carbon dioxide concentration was around 300 parts per million (ppm)
It is currently above 400 ppm
Data show a correlation between changing atmospheric carbon dioxide levels and temperature over thousands of years
Correlation does not equal causation
However, this is convincing evidence supporting the hypothesis that carbon dioxide emissions from human activity are driving up global temperatures
Records from the mid-1800s show an overall trend of increasing average global temperatures and corresponds with the time during which humans have been burning fossil fuels
90% of global carbon dioxide emissions come from industry and burning fossil fuels
As carbon dioxide, methane and water vapour are released, they act as greenhouse gases and trap heat within the Earth’s atmosphere
Human activities are responsible for almost all of the increase in greenhouse gases in the atmosphere over the last 150 years
Examiner Tips and Tricks
Remember that climate scientists do not disagree that the Earth has undergone major shifts in its climate with periods of warm and cold, as recorded with CO₂ data and ice cores. What they argue is different now is the rate of climate change.

Unlock more, it's free!
Did this page help you?
