Interpretation and Display of Quantitative Data (AQA GCSE Psychology): Revision Note
Exam code: 8182

Frequency tables
A frequency table measures the number of times a behaviour/action/phenomenon occurs, e.g.
the number of times litter is dropped
the number of times red is chosen for a T-shirt design
the number of goals scored by players in one season
To organise and make sense of frequency data a researcher will arrange it into a frequency table:
Score: Number of goals scored in one match by school team in one season | Tally | Frequency |
1 | 1 | |
2 | 3 | |
3 | 11 | |
4 | 20 | |
5 | 8 |
The frequency table above reveals that the mode for goals scored is 4 as this happened 20 times in one season
The median score is 4 as this is the value held by the 22nd item, which sits in the middle of the ordered data set
The mean score is calculated as follows:
Multiply each score by its frequency e.g. 1 x 1, 2 x 3 etc.
Add the total of these scores, in this case, it is 1 + 6 + 33 + 80 + 40 = 160
Divide this score by the total number of data points (43) to find the mean, in this case it is 3.72
The range is calculated by subtracting the lowest score from the highest score, in this case, it is 5 - 1 = 4
Histograms
On a histogram the x-axis (the horizontal line of the graph) represents the categories that have been measured, so in the frequency table above that would be the number of goals scored
On a histogram the y-axis (the vertical line of the graph) represents the frequencies of each category occurring so in the frequency table above that would be the frequency of the number of goals scored
Histograms do not have gaps between the bars (as opposed to bar charts which do have gaps between the bars as they compare categories of data)
Bar charts
Another type of frequency display can be achieved using a bar chart
The data shown on the x-axis of a bar chart is discrete (not continuous)
A bar chart deals with categorical data which does not necessarily fall in any particular order
If a researcher had conducted an experiment with 3 conditions they could use a bar graph to display the means of each condition
Bar charts do have gaps between each category on the x-axis, unlike histograms which do not
Scattergrams
Scattergrams are used to display the results of correlations
A scattergram shows the point at which two separate pieces of data meet
Each co-variable can be presented along the x-axis or the y-axis i.e. a strong positive correlation will be shown regardless of which axis is chosen per co-variable
The arrangement of points on the scattergram will indicate whether there is a positive correlation, a negative correlation or no correlation
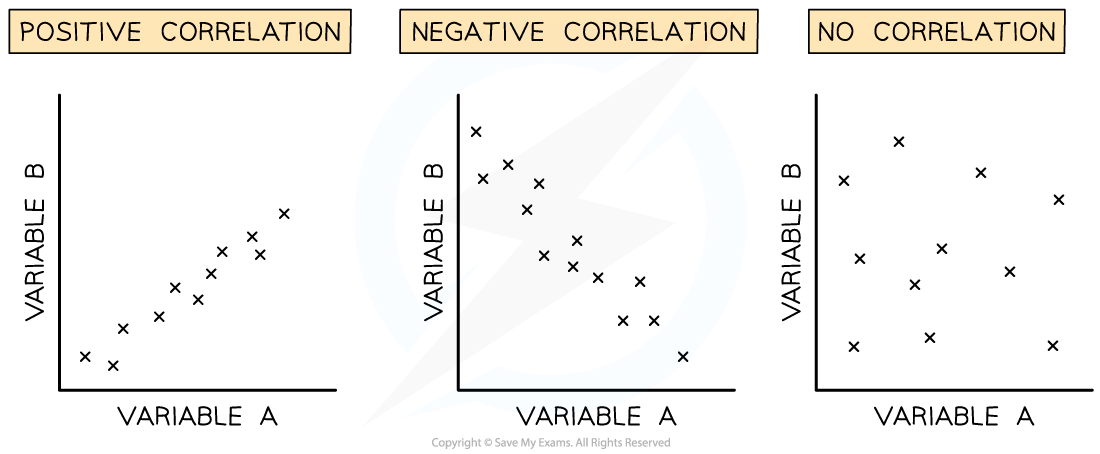
Scatter graphs showing different types of correlation
Examiner Tips and Tricks
You may be asked to either sketch or interpret the results of any of the graph types shown on this page so make sure you are clear about their different functions and displays.

Unlock more, it's free!
Join the 100,000+ Students that ❤️ Save My Exams
the (exam) results speak for themselves:

Was this revision note helpful?