The Demographic Transition Model (College Board AP® Human Geography): Study Guide

Population change over time
The demographic transition model explains changes in the natural increase rate as a function of economic development
The demographic transition model includes four definite stages and a theoretical fifth stage
The four stages have the following characteristics:
Stage 1 is characterized by high birth and death rates, resulting in very low or no growth
Stage 2 is characterized by high growth because death rates decline while birth rates remain high
The rapid increase in population associated with Stage 2 is referred to as a population explosion
Stage 3 is characterized by a sharp drop in crude birth rates as a result of changes in social and economic patterns, as well as government policies that encourage people to have fewer children
Stage 4 is characterized by birth rates that continue to decline until the natural increase rate drops to zero
The theoretical Stage 5 is characterized by a negative natural increase rate and a high elderly dependency ratio
Due to lower birth rates and long life expectancies, there would be fewer working-age people than people who depend on pensions, health care, and other government support

The image above represents the Demographic Transition Model
Stage 1: Low Growth / High Stationary
Crude birth rate (CBR) and crude death rate (CDR) are both very high so natural increase rate (NIR) is almost 0
CBR and CDR widely change from year to year
Primarily seen in hunter-gatherer societies
No countries located at this stage today
Stage 2: High Growth
CDR plummets while CBR stays the same, so NIR increases rapidly
The factors accounting for these changes are mainly social and economic, including improved:
health care
hygiene
sanitation
food production and storage
transport for food
Decreased Infant Mortality Rates
Examples of countries in Stage 2 include Yemen, Afghanistan, and Niger
The population pyramid associated with Stage 2 is a sharp triangle with a wide base, as shown below

Stage 3: Moderate Growth / Late Expanding
CBR starts to decline while CDR continues to stay low
Allows for slower growth
Factors accounting for the lower NIR in Stage 3 include the availability of family planning, lower infant mortality rates, increased mechanization reducing the economic need for workers, increased standard of living, and changing status of women
Countries in Stage 3 include India and Mexico

Stage 4: Low Growth
A country reaches this point when the CBR and CDR are almost equal leading to an NIR of almost 0
The factors leading to Stage 4 include more women employed in the workplace than at home, widespread availability of birth control, higher education levels, and pessimism about the future
Countries in Stage 4 include the United States, Canada, and New Zealand

Stage 5: Negative Growth
CBR falls below CDR, resulting in negative NIR and population loss
Factors leading to Stage 5 include more women in the workforce, increased education, later age of marriage, and longer life expectancies
Countries in this stage include Japan, Germany, and Italy
Countries in Stage 5 face challenges in caring for an aging population
Worked Example
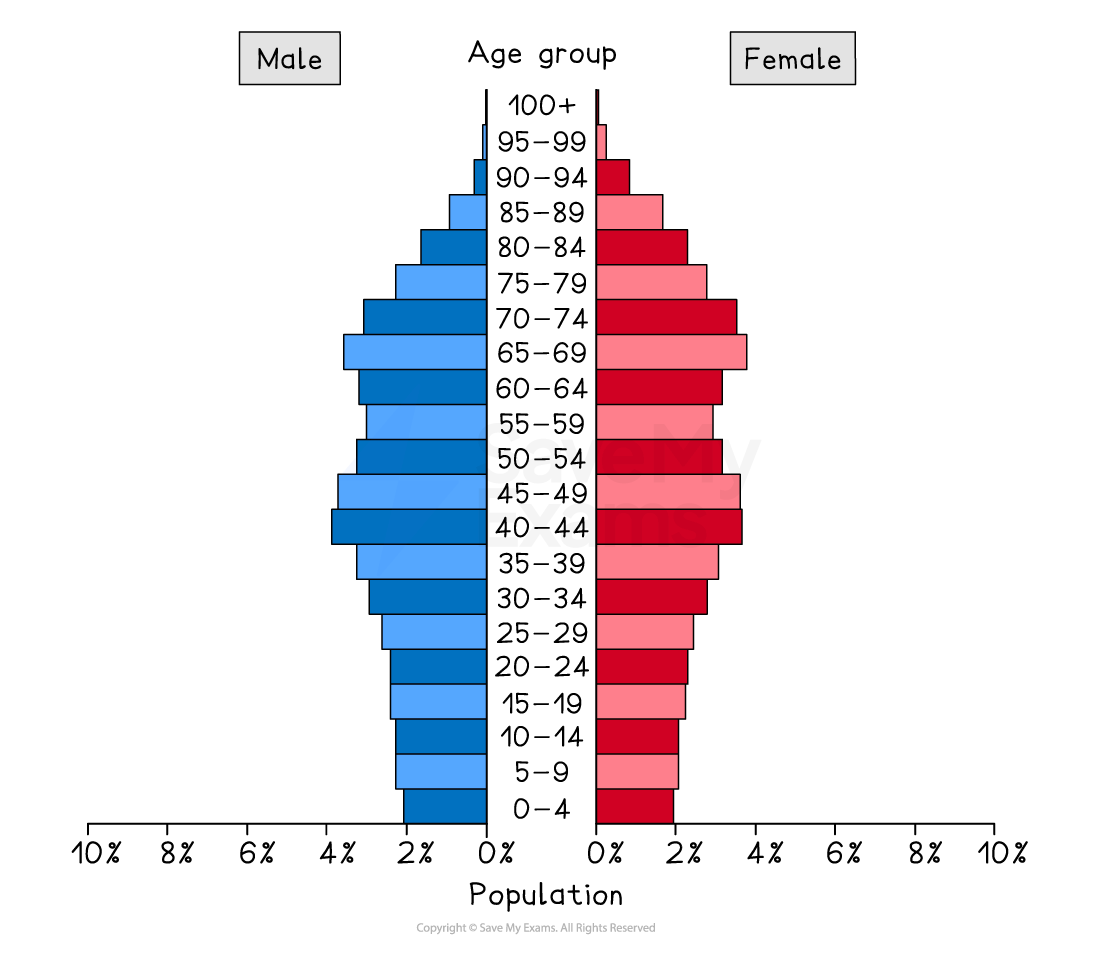
Compare the two population pyramids below:

A. Identify the demographic characteristics of each country with respect to the Demographic Transition Model.
B. Discuss one negative and one positive example of each country’s social or economic development.
C. For each country, predict one likely population challenge they will face in the next one to two decades.
Answers would include the following:
A. Country A has a large youth population and high fertility rates. Country B has lower birth rates and high life expectancy.
B. One negative economic issue for Country A is its high youth dependency ratio. One positive economic issue for Country A is the potentially large workforce going forward. One negative social issue for Country A is the need to provide childcare and education services for the young population. One negative economic issue for Country B is its ageing population, which will put pressure on pension and tax systems. One positive economic issue for Country B is its relatively large number of economically active members. One negative social issue for country B is the increasing elderly dependency ratio, which will put pressure on the working-age population.
C. Country A will face an increasing population with a large youth population. The government will need to focus on building schools and childcare facilities, as well as creating enough jobs for those youth when they age into employment. Country B will face an aging population and an increased elderly dependency ratio. This will put pressure on the healthcare and pension systems. The government may choose to encourage the immigration of guest workers for healthcare support.
Examiner Tips and Tricks
You will be expected to make several connections between population trends, the Demographic Transition Model (DTM), and the social and economic characteristics of specific countries and regions on the AP Exam. For example, you should be familiar with the general population characteristics of each stage in the DTM and be able to apply it to real-world examples. See the multiple-choice examples below.
In addition, you should remember which social and economic trends influence population growth. For example, increased economic activity, high literacy rates, and education for women lead to lower birth rates, lower total fertility rates, and lower infant mortality rates.
Worked Example
A country in the second stage of the demographic transition demonstrates which of the following?
A. An old population age structure
B. High birth rates, but low death rates
C. Low birth rates, low death rates, and low rates of population growth
D. High birth rates, high death rates, and low rates of population growth
E. High birth rates, high death rates, and high rates of population growth
Answer
B: Stage 2 of the DTM is characterized by high birth rates, but a declining death rate, which results in a population explosion.
Options A and C are both characteristic of Stage 5. Option D is characteristic of Stage 1. Option E is not a possible answer, as you cannot have high birth and death rates with a high rate of population growth.
Epidemiological transition
The Epidemiological Transition Model is used to describe how mortality and disease patterns change over time
The model focuses on causes of death in each state of the demographic transition
The Epidemiological Transition Model has four official stages and one theoretical stage
Stage 1 is characterized by death from infectious and parasitic diseases, such as the Black Plague and cholera pandemics
Stage 2 is characterized by a steep drop in death rates from infectious and parasitic diseases. This is due to an increase in antibiotics, better nutrition, and increased sanitation
Stage 3 is characterized by death from degenerative and human-created diseases, such as heart disease and cancer, and a decline in deaths from infectious diseases
Stage 4 is an extension of Stage 3 and is characterized by increased deaths from degenerative and human-created diseases but with an extended life expectancy due to better medical care
The theoretical Stage 5 is characterized by the reemergence of infections and parasitic diseases

Unlock more, it's free!
Did this page help you?
