Drawing Histograms (Edexcel IGCSE Maths A: Higher): Revision Note
Exam code: 4MA1

Drawing histograms
What is a histogram?
A histogram looks similar to a bar chart, but there are important differences
Bar charts are used for discrete (and sometimes non-numerical) data
In a bar chart, the height (or length) of a bar determines the frequency
There are usually gaps between the bars
Histograms are used with continuous data, grouped into class intervals (usually of unequal width)
In a histogram, the area of a bar determines the frequency
This means it is difficult to tell anything simply from looking at a histogram
Some basic calculations will be needed for conclusions and comparisons to be made
There are no gaps between the bars
How do I draw a histogram?
Drawing a histogram first requires the calculation of the frequency densities for each class interval (group)
Use
Exam questions often ask you to finish an incomplete histogram, rather than start with a blank graph
Once the frequency densities are known, the bars (rectangles) for each class interval can be drawn
with widths being measured on the horizontal (x) axis
and the height of each bar (the frequency density) being measured on the vertical (y) axis
As the data is continuous, the bars will be touching
Examiner Tips and Tricks
Always work out and write down the frequency densities.
It is easy to make errors and lose marks by going straight to the graph.
Method marks may depend on showing you know to use frequency density rather than frequency.
Worked Example
A histogram is shown below representing the distances achieved by some athletes throwing a javelin.
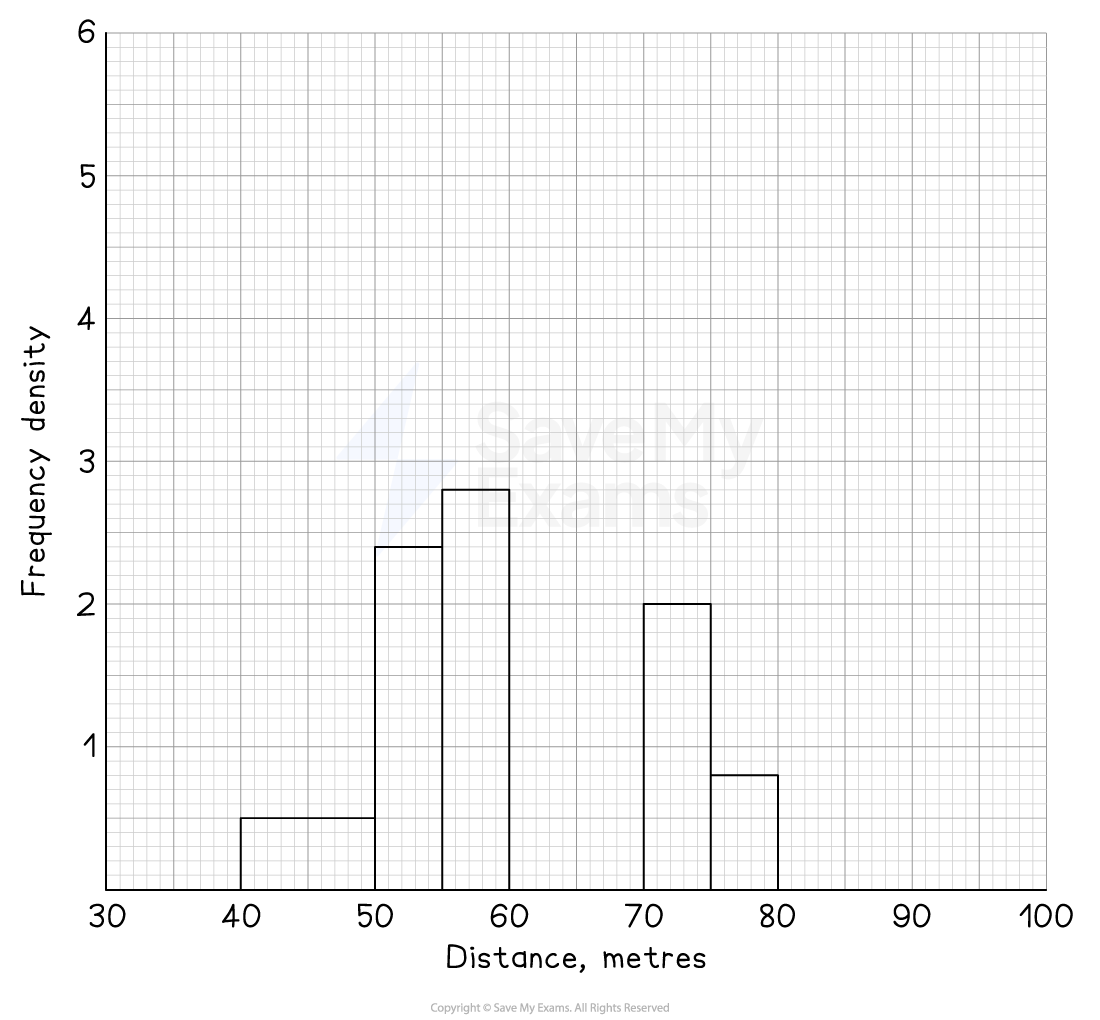
There are two classes missing from the histogram.
These are:
Distance, m | Frequency |
8 | |
2 |
Add these to the histogram.
Answer:
Before completing the histogram, remember to show clearly you've worked out the missing frequency densities
Distance, m | Frequency | Class width | Frequency density |
8 | 70 - 60 = 10 | 8 ÷ 10 = 0.8 | |
2 | 100 - 80 = 20 | 2 ÷ 20 = 0.1 |
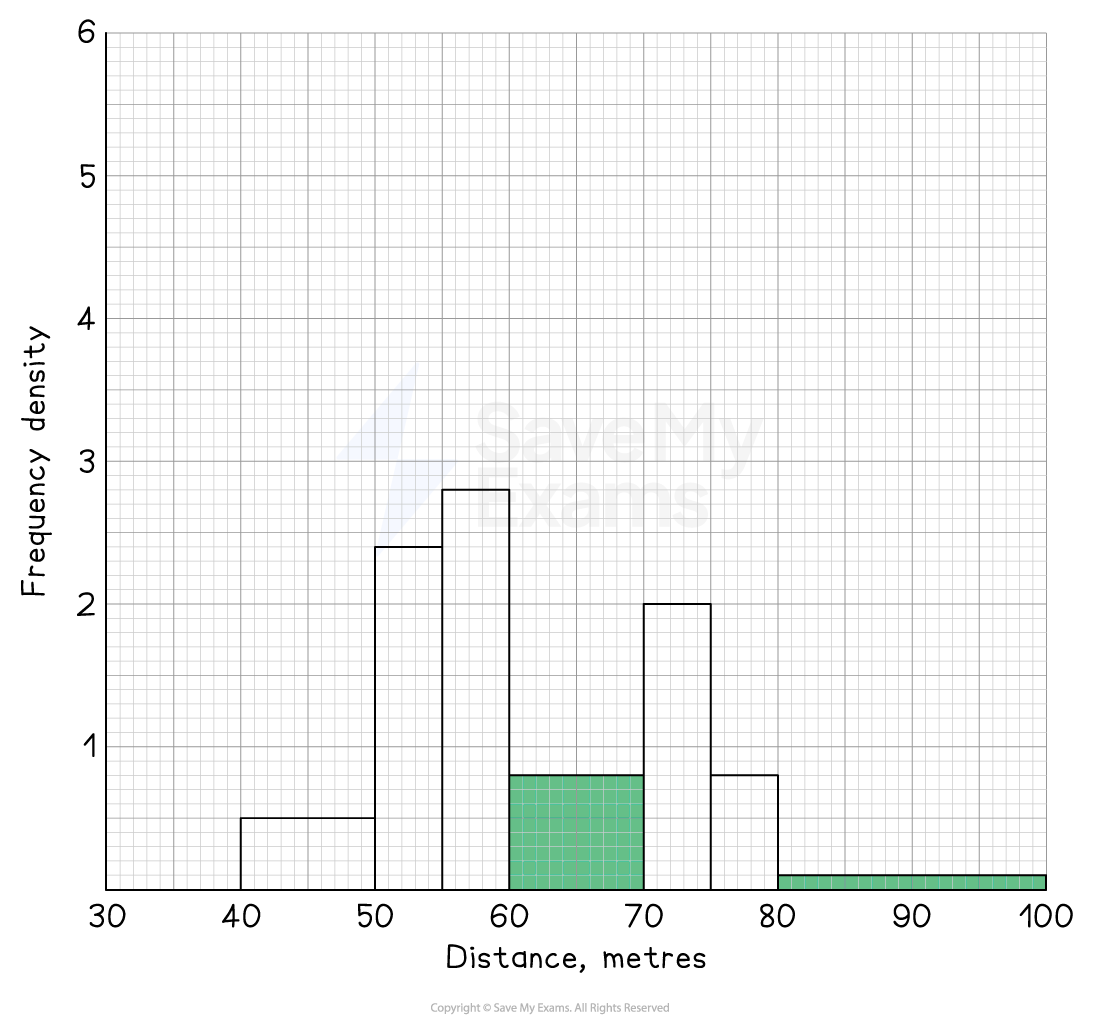
Now the bars can be drawn on the histogram
They should stretch along the x-axis from the start to the end of the class interval
The heights will be equal to the frequency densities

Unlock more, it's free!
Join the 100,000+ Students that ❤️ Save My Exams
the (exam) results speak for themselves:

Was this revision note helpful?
Build on this topic
Questions students ask about Drawing Histograms
Real questions from students revising this topic on Save My Exams
How do you draw a histogram step by step?
Work out the frequency density for each class, then draw touching bars whose widths are the class intervals and whose heights are the frequency densities.
- Find each class width: upper boundary − lower boundary
- Calculate frequency density = frequency ÷ class width
- Write the frequency densities down in a table. Method marks may depend on showing you used frequency density rather than frequency, so don't go straight to the graph
- Set up the axes: the continuous data scale on the x-axis, frequency density on the y-axis
- Draw each bar from the start to the end of its class interval, at a height equal to its frequency density
- Leave no gaps — the data is continuous, so the bars touch
Page example: adding the two missing javelin classes
- 60 ≤ x < 70: width 10, frequency density 8 ÷ 10 = 0.8, so a bar from 60 to 70 at height 0.8
- 80 ≤ x < 100: width 20, frequency density 2 ÷ 20 = 0.1, so a bar from 80 to 100 at height 0.1
Exam questions often ask you to finish an incomplete histogram, so use the scale already given.
Why do the bars touch in a histogram?
The bars touch because a histogram shows continuous data: one class ends exactly where the next begins, so no values are left out in between.
- Continuous data — distance, time, mass — can take any value in a range, not just separate whole numbers
- On this page’s javelin histogram the class 60 ≤ x < 70 is followed by 70 ≤ x < 75, so a throw of 69.9 m sits in the first class, right up to the boundary at 70
- So each bar must finish exactly where the next one starts on the x-axis
- A gap would wrongly suggest no values are possible in that range: the empty space from 60 m to 70 m only disappears once the missing bar (frequency density 0.8) is drawn in
Compare with a bar chart:
- Bar charts show discrete or non-numerical data, such as shoe size or favourite colour
- There is nothing "between" the categories, so gaps are left to separate them
Draw each bar from the exact start to the exact end of its class and they will touch automatically.