Data-Based Questions (Paper 1B) (DP IB Chemistry: SL): Exam Questions

3 hours12 questions
1a1 mark

The properties of elements show predictable patterns across a period. The table below shows the atomic radius and first ionization energy for the elements in Period 3 of the periodic table.

Element

Atomic number

First ionisation energy / kJ mol-1

Atomic radius / pm

Sodium (Na)

11

496

160

Magnesium (Mg)

12

738

140

Aluminium (Al)

13

578

124

Silicon (Si)

14

787

114

Phosphorus (P)

15

1012

109

Sulfur (S)

16

1000

104

Chlorine (Cl)

17

1251

100

Argon (Ar)

18

1520

101

State the element in Period 3 that requires the least energy to remove one mole of its valence electrons.

1b2 marks

Describe the general trend for:

i) Atomic radius from sodium to chlorine.

[1]

ii) First ionization energy from sodium to argon.

[1]

1c3 marks

Explain the general increase in the first ionisation energy across Period 3.

1d3 marks

Explain why the first ionisation energy of aluminium is lower than that of magnesium.

1e2 marks

Explain how the data for first ionisation energy supports the fact that metallic character decreases across Period 3.

2a2 marks

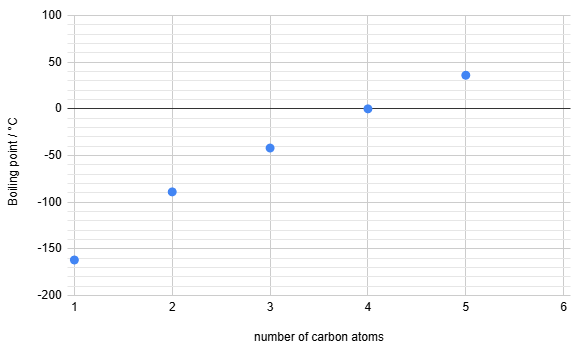
A homologous series is a family of compounds with the same functional group and similar chemical properties. The boiling points for the first five straight-chain alkanes are shown in the table and the graph below.

Alkane

Molecular formula

Molar mass / g mol-1

Boiling point / °C

Methane

CH4

16.0

-162

Ethane

C2H6

30.1

-89

Propane

C3H8

44.1

-42

Butane

C4H10

58.1

0

Pentane

C5H12

72.2

36

Graph showing boiling points of alkanes by number of carbon atoms, from 1 to 5. Data points increase upwards from -160°C to 36°C.

Define the term homologous series.

2b2 marks

Describe the relationship between the number of carbon atoms and the boiling point for the alkanes shown in the data.

2c1 mark

Using the graph, estimate the boiling point of the next member of the homologous series, hexane (C6H14).

2d3 marks

Explain the trend in boiling points from methane to pentane in terms of the intermolecular forces present.

2e3 marks

The boiling point of ethanol (CH3CH2OH, Mr = 46.0) is 78 °C.

Explain why this is significantly higher than the boiling point of propane (C3H8, M = 44.1), which has a similar molar mass.

2f3 marks

Pentane has a branched structural isomer, 2,2-dimethylpropane, which has a boiling point of 10 °C.

Explain why the boiling point of 2,2-dimethylpropane is lower than that of pentane (36 °C).

3a2 marks

A student performed a titration to determine the concentration of ethanoic acid (CH3COOH) in a sample of commercial vinegar. The vinegar was first diluted by a factor of 10. A 25.00 cm3 sample of the diluted vinegar was titrated against a standard solution of 0.100 mol dm-3 sodium hydroxide (NaOH) using phenolphthalein indicator.

The results of the titration are shown in the table below. The uncertainty for each burette reading is ±0.05 cm3.

Titration

Initial burette reading / cm3

Final burette reading / cm3

Rough

0.00

22.50

1

0.50

22.65

2

22.65

44.80

3

1.20

23.40

Write the balanced chemical equation for the reaction.

3b1 mark

State the colour change observed at the end-point of the titration.

3c3 marks

i) Calculate the mean titre, in cm3, using the concordant results.

[2]

ii) Calculate the uncertainty of a single titre volume.

[1]

3d3 marks

Calculate the concentration, in mol dm-3, of ethanoic acid in the diluted vinegar.

3e1 mark

Calculate the concentration, in mol dm-3, of ethanoic acid in the original, undiluted vinegar.

3f3 marks

The student noticed an air bubble in the tip of the burette after filling it, which was gone by the end of the first accurate titration (Trial 1).

State and explain the effect this error would have on the calculated concentration of ethanoic acid.

4a2 marks

The standard enthalpy change of combustion (ΔHcӨ) for methane can be determined theoretically using standard enthalpy of formation (ΔHfӨ) data. The table below provides relevant values.

Substance

Formula

State

Standard enthalpy of formation (ΔHfӨ) / kJ mol-1

Methane

CH4

g

-74

Oxygen

O2

g

0

Carbon dioxide

CO2

g

-394

Water

H2O

l

-286

Define the term standard enthalpy of formation.

4b2 marks

Write the balanced chemical equation for the complete combustion of methane, including state symbols.

4c3 marks

Construct a Hess's Law energy cycle using the provided standard enthalpy of formation data to calculate the standard enthalpy change of combustion for methane.

4d3 marks

The enthalpy of combustion for methane can also be estimated using average bond enthalpies from section 12 of the data booklet.

Calculate a value for the enthalpy of combustion of methane using this method.

4e2 marks

Explain why the value calculated in part (c) is more accurate than the value calculated in part (d).

5a2 marks

A sample of H2O is heated at a constant rate, and its temperature is recorded over time. The process starts with ice at -10 °C and ends with steam at 110 °C. The resulting heating curve is shown below.

Graph showing temperature vs heat added with sections A to E. Temperature ranges from -10°C to 100°C, depicting phase changes of a substance.

i) State the process occurring during section B.

[1]

ii) Identify the section where the substance exists only as a liquid.

[1]

5b3 marks

Explain, in terms of the energy of the particles, why the temperature remains constant during section D.

5c2 marks

Explain why the length of the plateau in section D is significantly greater than the length of the plateau in section B.

5d3 marks

Calculate the heat energy, in kJ, required to raise the temperature of 50.0 g of liquid water from 0 oC to 100 oC (section C).

The specific heat capacity of liquid water is 4.18 J g-1 oC-1.

5e2 marks

The slope of section A is steeper than the slope of section C.

Suggest what this indicates about the specific heat capacity of ice compared to liquid water.

6a2 marks

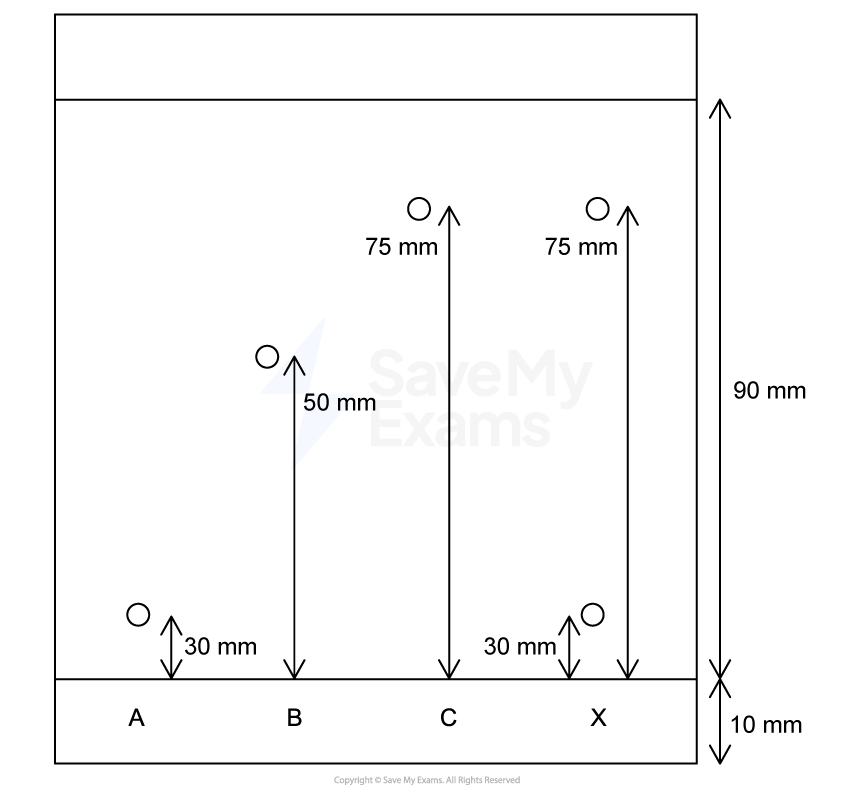
A student used paper chromatography to separate a mixture of coloured inks. A spot of an unknown mixture, X, and separate spots of three known food dyes, A, B, and C, were placed on a pencil line drawn on a piece of chromatography paper. The paper was then suspended in a beaker containing a non-polar solvent, ensuring the solvent level was below the pencil line. The beaker was covered with a lid.

The resulting chromatogram at the end of the experiment is shown below.

Diagram showing four labelled points A, B, C, X with measured distances: A to B 30mm, B to C 50mm, C to X 30mm, all within a 90mm by 10mm rectangle.

Identify the stationary phase and the mobile phase in this experiment.

6b2 marks

Calculate the retardation factor (Rf) for dye B.

6c2 marks

Deduce the composition of the unknown mixture X. Justify your answer.

6d2 marks

Explain, in terms of adsorption and solubility, why the dyes separate on the chromatogram.

6e4 marks

The main component of chromatography paper is cellulose, which is a polar substance.

i) Identify which dye, A, B, or C, has the greatest affinity for the mobile phase.

[1]

ii) Explain why dye C travelled further up the paper than dye A.

[3]

6f1 mark

Suggest one reason why the beaker was covered with a lid during the experiment.