Applying Techniques in Chemistry (DP IB Chemistry): Revision Note

Applying techniques in chemistry
You should be familiar with practical techniques in the following categories:
Volumetric analysis techniques
Separation techniques
Purification techniques
Other techniques and experiments
Volumetric analysis
Volumetric analysis techniques including:
Preparing a standard solution
Carrying out dilutions
Performing titrations (acid–base titration and redox titration)
Volumetric analysis involves using the volume and concentration of a solution to determine the concentration of another
The known solution is called a standard solution (or volumetric solution)
The most common method is titration
The volumes are measured using two precise pieces of equipment:
Burette – delivers the titrant (known solution) drop by drop.
Volumetric pipette – accurately measures a fixed volume of the unknown solution.
Before the titration can be done, the standard solution must be prepared
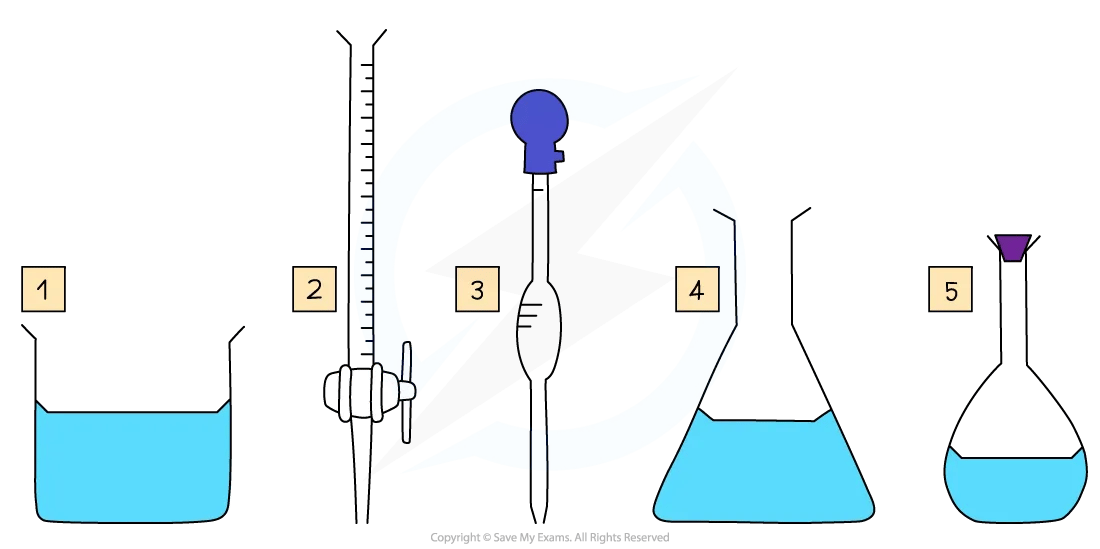
Specific apparatus must be used both when preparing the standard solution and when completing the titration, to ensure that volumes are measured precisely
Key pieces of apparatus used to prepare a volumetric solution and perform a simple titration
Making a standard / volumetric solution
A standard solution (or volumetric solution) is one with a precisely known concentration, used in quantitative analysis
These solutions are prepared accurately using:
A 3-decimal place balance to weigh the solute
A volumetric flask to ensure exact final volume
Careful technique helps to minimise measurement uncertainty and ensure reliability in titrations and other analyses
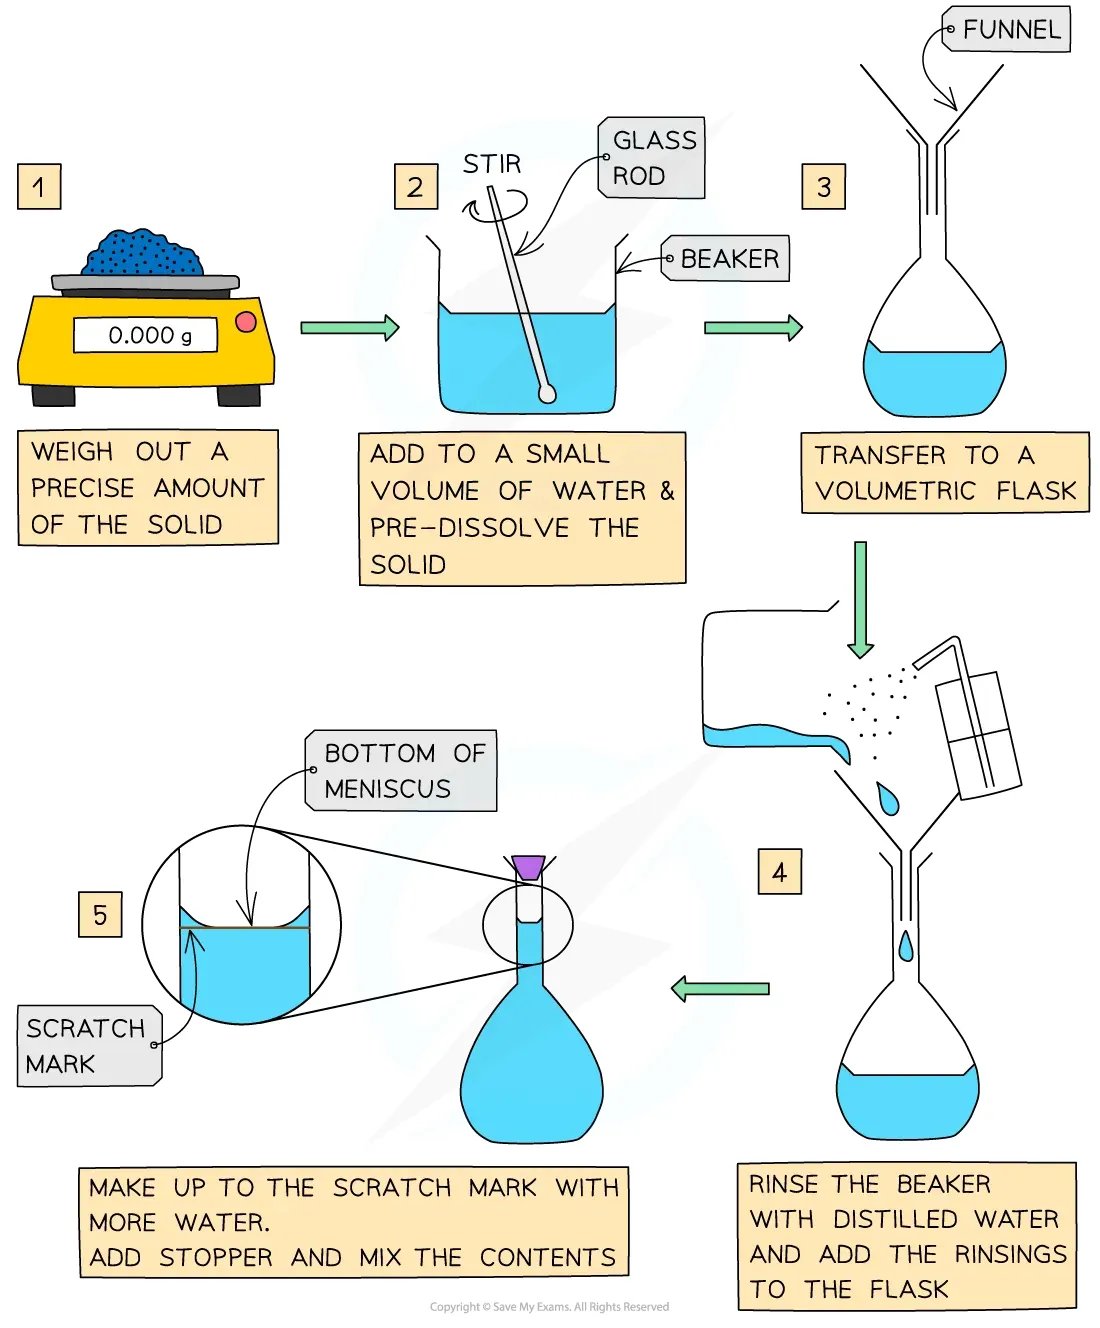
How to prepare a standard solution
Worked Example
Calculate the mass of sodium hydroxide, NaOH, required to prepare 250 cm3 of a 0.200 mol dm-3 solution.
Answer:
Step 1: Find the number of moles of NaOH needed from the concentration and volume:
number of moles = concentration (mol dm-3) x volume (dm3)
n = 0.200 mol dm–3 x 0.250 dm3
n = 0.0500 mol
Step 2: Find the molar mass of NaOH:
Mr = 22.99 + 16.00 + 1.01 = 40.00 g mol–1
Step 3: Calculate the mass of NaOH required:
mass = moles x molar mass
mass = 0.0500 mol x 40.00 g mol–1 = 2.00 g
Carrying out dilutions
Concentration: The amount of solute dissolved in a solvent to make 1 dm3 of solution
Common units:
mol dm⁻³
g dm⁻³
parts per million (ppm)
Solute: Substance being dissolved
Solvent: Substance doing the dissolving (often water)
A concentrated solution contains a large amount of solute
A dilute solution contains a small amount of solute
A concentrated solution can be diluted to form a dilute solution
For example, diluting 500 cm3 of a stock 1.0 mol dm–3 standard solution to a 0.5 mol dm–3 standard solution
Take the 500 cm3 of the 1.0 mol dm–3 standard solution
Add 500 cm3 of deionised water
There is now 1000 cm3 of a 0.5 mol dm–3 standard solution
A series of stepwise dilutions to achieve very low concentrations
Each step reduces concentration by a constant factor (e.g. 10×):
For example adding 100 cm3 of stock to 900 cm3 of water for a 1:10 dilution
Repeat using the diluted solution from the previous step
Performing titrations
Titrations include acid-base titrations and redox titrations:
Acid–base titrations involve the neutralization between an acid and a base.
Redox titrations involve simultaneous oxidation and reduction reactions, e.g.:
Fe2+ + MnO4− → Fe3+ + Mn2+
The key piece of equipment used in the titration is the burette
Burettes are usually marked to a precision of 0.10 cm3
Since they are analogue instruments, the uncertainty is recorded to half the smallest marking, in other words to ±0.05 cm3
The equivalence point in a titration is when stoichiometrically equivalent amounts of reactants have been mixed
The endpoint is the observable change (usually a colour change) that signals the equivalence point
In acid–base titrations, this is detected using an indicator
In some redox titrations (e.g. MnO4− as the titrant), no indicator is needed due to the inherent colour change
For more information about choosing indicators, see our revision note on Choosing an Acid-Base Indicator
Using an indicator in titrations
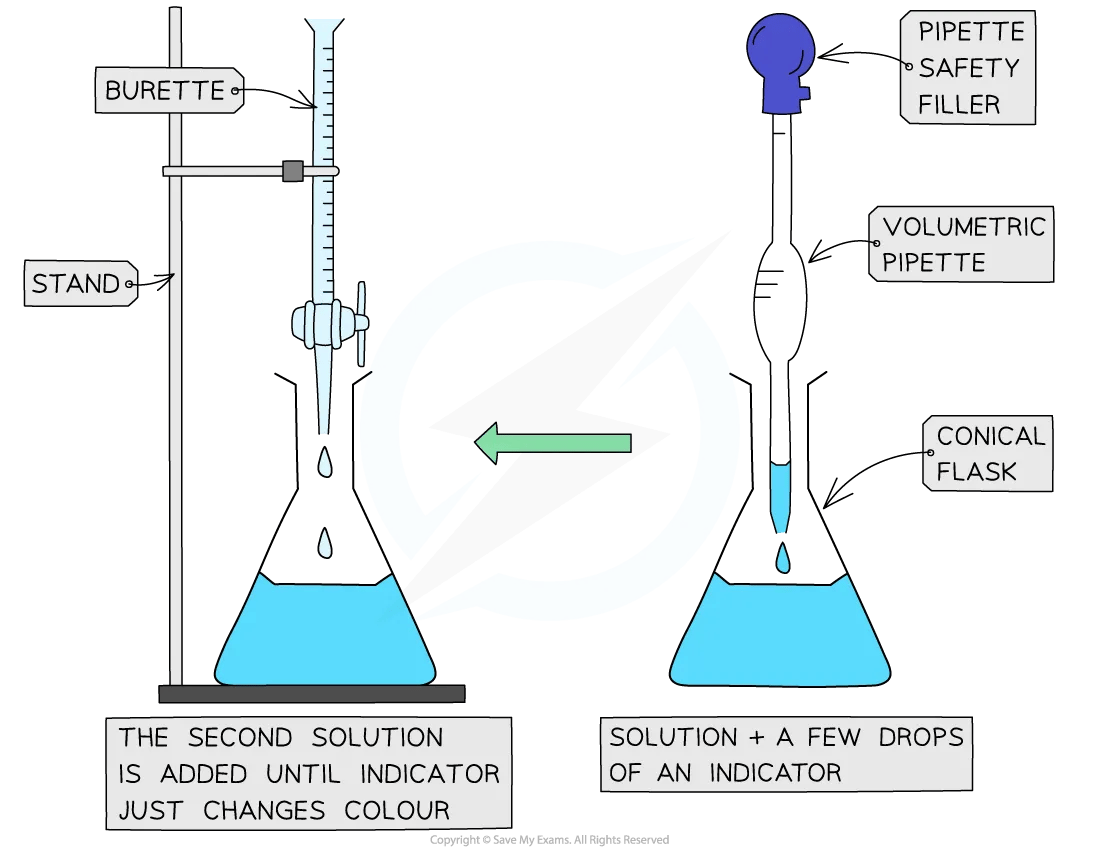
Method
Measure a fixed volume (typically 20.0 or 25.0 cm3) of one solution using a volumetric pipette and transfer it into a conical flask
Fill the burette with the second solution and record the starting volume (usually filled to 0.00 cm3)
Add a few drops of an appropriate indicator to the solution in the conical flask, if needed
Place a white tile under the flask to make the colour change easier to see
Begin the titration by slowly opening the burette tap, adding the titrant to the flask in small portions
Swirl the flask after each addition to mix the solutions thoroughly
As you approach the endpoint, slow the addition to dropwise
Close the tap as soon as one drop causes a permanent colour change
Repeat the titration until you obtain concordant results (two or more volumes within ±0.10 cm3)
Recording and processing titration results
Both the initial and final burette readings should be recorded and shown to a precision of ±0.05 cm3, the same as the uncertainty
A typical layout and set of titration results
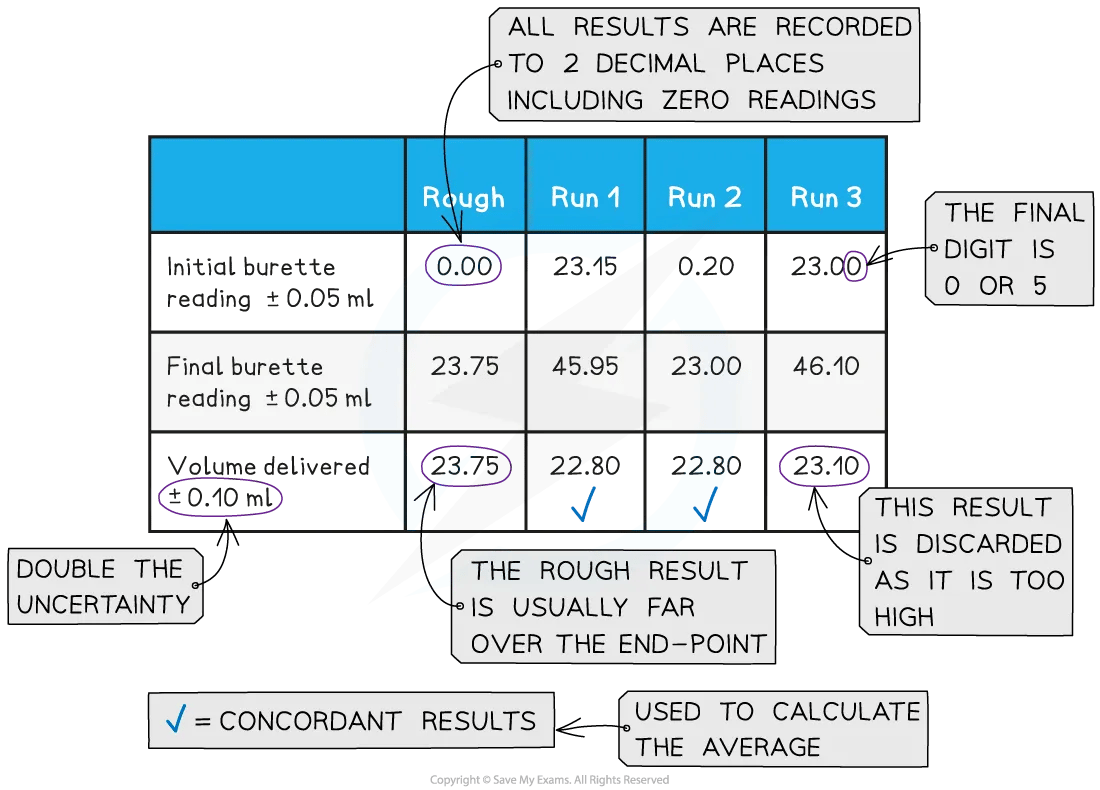
The volume delivered (titre) is calculated and recorded to an uncertainty of ±0.10 cm3
For more information about working with uncertainties, see our revision note on Processing Uncertainties in Chemistry
Concordant results are then averaged, and non-concordant results are discarded
For more information about calculating average titres, see "What is the mean average?" in our Applying General Mathematics in Chemistry revision note
Appropriate titration calculations are then performed, as shown in our revision note on Concentration Calculations
Separation of mixtures
The required separation techniques covered in our revision note on Separating Mixtures include:
Filtration – separates insoluble solids from liquids.
Crystallisation
Distillation:
Simple distillation – separates liquids from solutions based on boiling point.
Fractional distillation – separates mixtures of liquids with closer boiling points using a fractionating column.
Chromatography:
Paper and thin-layer chromatography (TLC) operate on the same principle:
Stationary phase: chromatography paper (paper) or a silica/alumina layer on a glass/plastic plate (TLC)
Mobile phase: any suitable liquid solvent
Separation: based on solubility
Detection: UV light or chemical locating agents like ninhydrin help reveal colourless spots
Purification techniques
The specific purification techniques explicitly stated in the syllabus are:
Recrystallisation
Melting point determination
Recrystallisation
Recrystallisation is used to purify an impure solid
The solid is dissolved in a suitable hot solvent, then allowed to cool so the pure compound crystallises out
The product should be of higher purity
This technique works because the desired compound is less soluble at lower temperatures, while impurities remain dissolved
For more information about recrystallisation, see our revision note on Separating Mixtures
Melting point determination
The melting point of a solid is indicative of its purity and identity
It can be compared to a known value to identify or confirm a compound
The proximity of a melting point to the actual data book value can express purity
Impurities tend to lower the melting point of a solid
The melting point range also reveals the degree of purity
Pure substances have sharp well-defined melting points
Impure substances have a broad melting point range, i.e. a large difference between when the substance first melts and when it completely melts
The accuracy of the result depends on the apparatus and method used:
Different apparatus used to determine the melting point of a sample
 |  |
 | |
However, there are some common key skills:
Correctly preparing the melting point tubes
Heating the tubes very slowly
Repeating to get a range of measurements (three would be normal)
The sample solid must be totally dry and finely powdered:
This can be achieved by crushing it with the back of a spatula onto some filter paper or the back of a white tile (this absorbs any moisture)
Use the first tube to find the approximate melting point range and then repeat using a much slower heating rate
Other experiments and techniques
Other specific experiments and techniques explicitly stated in the syllabus are:
Calorimetry
For more information about calorimetry, see our revision note on Calorimetry
Electrochemical cells
For more information about experiments involving electrochemical cells, see the relevant revision notes in our Electron Transfer Reactions topic
Drying to constant mass
Reflux
Colorimetry / spectrophotometry
Physical and digital molecular modelling
Drying to constant mass
This technique is used to determine the amount of water or volatile substances in a sample
Procedure:
Record the initial mass using a balance
Heat the sample in an oven or drying chamber at a controlled temperature
At regular intervals, cool the sample in a desiccator and reweigh it
Repeat until the mass stays the same, indicating all moisture has been removed
Application:
Commonly used to calculate water of crystallisation in hydrated transition metal compounds
Heating under reflux
Many organic reactions are slow at room temperature and require heating to proceed efficiently
Reflux involves heating a reaction mixture so that it boils, while a condenser prevents the loss of volatile components
Doing this ensures reactants remain in the system, allowing complete reaction without evaporation
Unlike distillation, which separates components, reflux retains all substances in the flask
Example reactions where heating under reflux could be used include:
Oxidation of a primary alcohol to a carboxylic acid (e.g. using acidified potassium dichromate)
Esterification reactions between an alcohol and a carboxylic acid using a concentrated acid catalyst
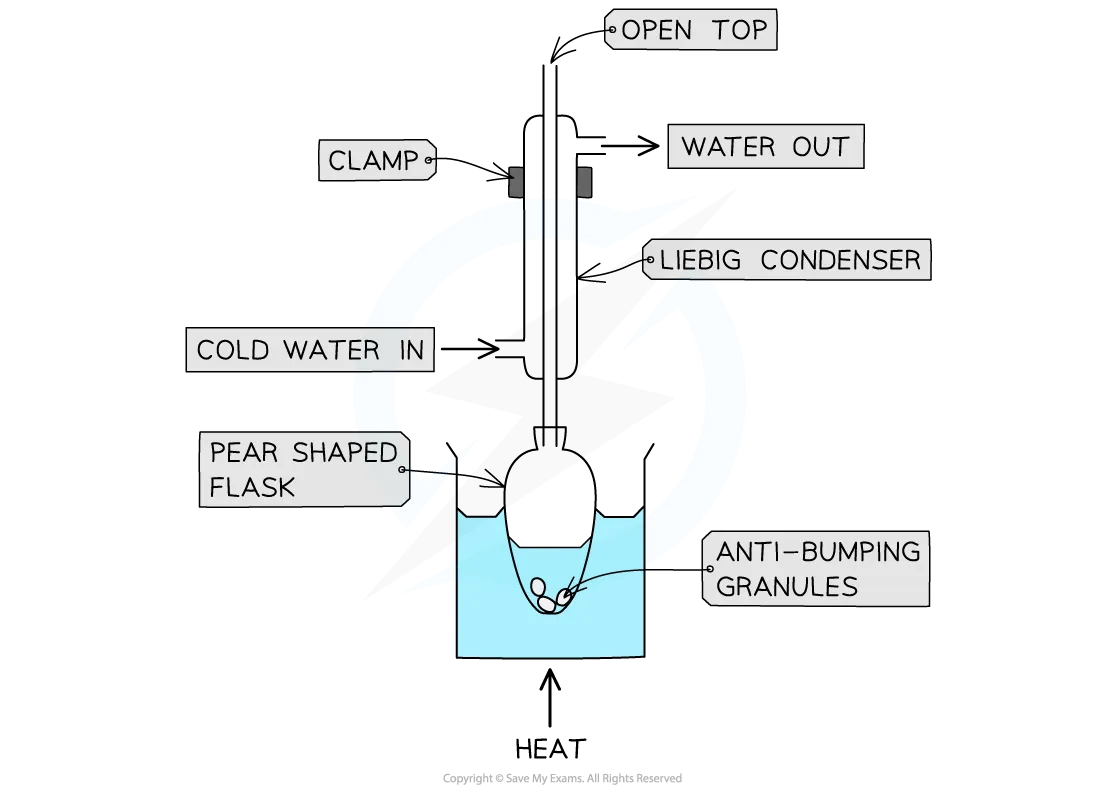
Method
Use a pear-shaped or round-bottomed flask
Add anti-bumping granules to ensure smooth boiling
Heat using a water bath or heating mantle for controlled temperature
Fit a vertical condenser using Quickfit apparatus (joints often greased)
Run cold water in at the bottom and out at the top of the condenser to maintain efficient condensation (known as a water jacket)
The mixture boils gently while vapours condense and return to the flask
Once heating is complete, allow the mixture to cool to room temperature
Heating under reflux practical equipment
Colorimetry / spectrophotometry
Colorimetry and spectrophotometry are techniques used to determine the concentration of a solution by measuring how much light it absorbs at specific wavelengths
Both techniques use the same basic method:
A light source emits a beam across a range of wavelengths
The sample solution absorbs some wavelengths of light based on its composition and concentration
A detector records the amount of light absorbed (absorbance) or light transmitted
The detector on a colorimeter measures the intensity of light which is directly related to the concentration of the solution
It is a relatively quick process although not as precise as spectrophotometry, especially with low concentrations or complex mixtures
The detector on a spectrophotometer measures the absorbance of each wavelength of light
The resulting absorption spectrum is plotted, showing the characteristic absorption peaks of the sample
The concentration is then determined by comparing this spectrum to a calibration curve
Spectrophotometry is highly sensitive and accurate, making it suitable for analysing low concentrations and complex mixtures
It is widely used in research, quality control, drug analysis, environmental monitoring and food testing
For more information about calorimetry, see our revision note on Measuring Rates of Reaction
Physical and digital molecular modelling
Physical molecular modelling is the creation of three-dimensional models using materials such as plastic balls and sticks (molymods)
It serves as a tool to understand molecular geometry, bond angles and the overall spatial arrangement of atoms within a molecule
Digital molecular modelling uses specialist computer software to generate accurate and detailed 3D models of molecules
By giving specific data, such as bond lengths and angles, the software can produce highly accurate representations of molecules, including their electronic structures
It allows the study of more complex molecules, especially ones that are challenging to construct
It allows observations of molecular movements and reactions in real time
Digital molecular modelling provides access to various tools and simulations that can predict:
Molecular properties
Behaviour in different environments
Potential interactions with other molecules
These simulations aid researchers in drug design, material science and many other applications

Unlock more, it's free!
Did this page help you?
