Circulatory Systems, Heart & Blood Vessels (Cambridge (CIE) IGCSE Biology): Exam Questions

Exam code: 0610 & 0970

4 hours44 questions
1a
Sme Calculator
5 marks

A student wanted to exert themselves in light exercise and monitor their heart rate for a period afterwards.

Describe a method they could follow to determine their heart rate after exercise.

1b
Sme Calculator
4 marks

A stopwatch was used to measure how long a student exercised for. 

Fig. 1 shows three stopwatches which are ready for the student to use. One of the stopwatches has an error.

stopwatch

Fig. 1

(i)

Identify the stopwatch with the error and state the type of error the stopwatch has. 

[2]

(ii)

Describe what the student should do to correct the error. 

[1]

(iii)

Identify and explain one type of variable that the time measured by the stopwatch could be in an investigation. 

[1]

1c
Sme Calculator
3 marks

Students participating in an investigation to record their heart rate are considered research subjects. Ethical procedures associated with using students in this way should be followed.

(i)

Describe an ethical consideration that should be considered before students take part in the investigation. 

[1]

(ii)

Describe two health and safety precautions which should be adhered to as part of the investigation. 

[2]

1d
Sme Calculator
12 marks

A student had a resting heart rate of 75 bpm. 

Fig 2. shows the same student's results after completing five different exercises and recording their heart rate each time. Each exercise was carried out for two minutes.
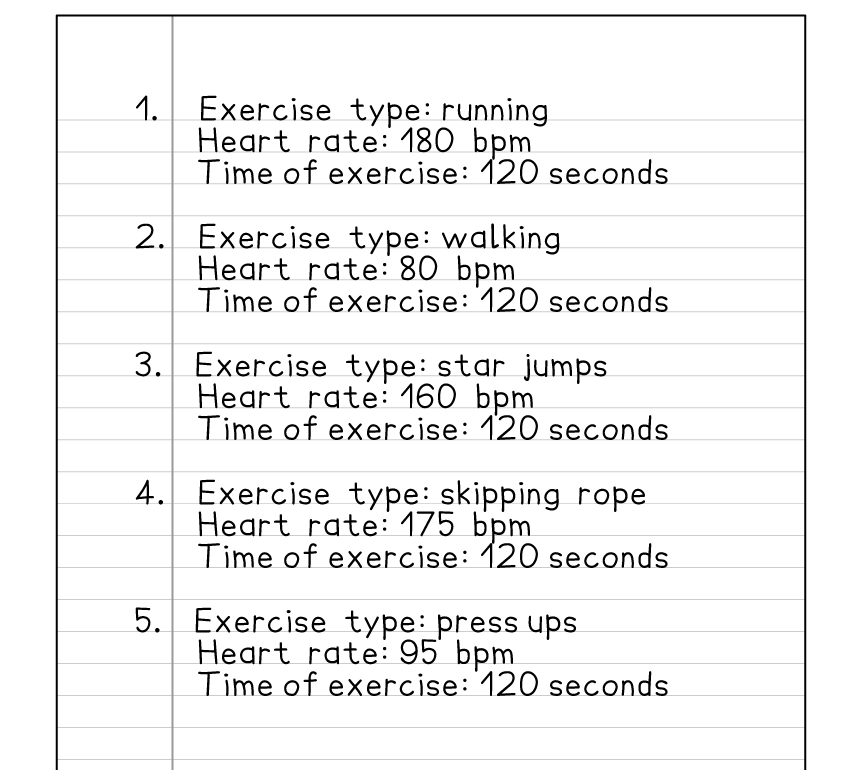
results

Fig. 2

(i)

Prepare a table to record the results shown in Fig. 2. Your table should include clear headings and units where applicable. 

[4]

(ii)

Identify the independent variable and the dependent variable from the information given and Fig. 2.

[2]

(iii)

Use the information above and Fig. 2 to identify the variable that was kept constant during the investigation (control variable). 

[1]

(iv)

Describe how the student could make their results more reliable and explain why this increases the accuracy of the data.

[2]

(v)

Calculate the percentage change in heart rate when the student carried out running. 

[3]

Did this page help you?

2a
Sme Calculator
9 marks

Blood vessels can be modelled using straws of different diameters. Students investigated the flow of a viscous liquid through three different diameters of straws. Fig. 1 shows their experimental set up.

set-up

Fig. 1

Below is the method the students followed. 

  1. Place a piece of each different diameter straw securely into a clamp and stand, and position above an empty beaker. 

  2. Place a funnel at the top of the first tube to be tested.

  3. Measure out 300 cm3 of the liquid.

  4. Slowly but continuously pour the liquid into the funnel and immediately start the stopwatch.

  5. Record the time taken for the entire volume of liquid to flow out of the tubing.

  6. Repeat the test two more times and calculate an average time.

  7. Repeat the whole experiment with the other remaining diameters of tube.

(i)

Suggest the apparatus the students should use to accurately measure 300 cm3 of liquid.

[1]

(ii)

 Describe a method to ensure 300 cm3 of liquid is measured accurately. 

[3]

(iii)

Suggest a unit of time the students should use to measure how long it takes for the liquid to flow through each tube and explain why this unit is most appropriate. 

[3]

(iv)

Describe a source of error that may arise from the method above and explain how to overcome this error. 

[2]

2b
Sme Calculator
9 marks

Table 1 shows the data collected by students when following the method described in part (a). 

Table 1

diameter of straw / cm3

time for liquid to flow through the straw / seconds

trial 1

trial 2

trial 3

mean

0.5

3

2

3

2.7

1

2

2

2

2.0

2

1

0.5

0.8


(i)

Calculate the mean for the 2 cm3 diameter straw.

[1]

(ii)

The following formula can be used to calculate the flow rate. Use the mean time for the liquid to flow through the straws to calculate the flow rate of the three straws. 

Flow rate = volume ÷ time

Where flow rate is measured in cm3/sec, volume in cm3 and time in seconds

Give each answer to three significant figures. 

[3]

(iii)

The height of the tubes has been cut to 20 cm.

Recall and use the equation for the volume of a cylinder to calculate the volume of the 2 cm3 diameter tube.  Give each answer to two significant figures and include the units for volume. 

[5]

Did this page help you?

1a10 marks

A student monitored their pulse rate after exercise. The student’s pulse rate before exercise was 62 beats per minute. 

The results are shown in Table 2.1.

Table 2.1

time after exercise /minutes

pulse rate /beats per minute

0

156

1

108

2

78

3

66

4

62

5

62

(i) Plot a line graph on the grid of the data in Table 2.1. Include a line of best fit.

Square grid paper with black lines forming evenly spaced squares, typically used for mathematical graphs, drawings, or diagrams.

[4]

(ii) Describe the relationship shown in your graph, between pulse rate and time after exercise. 

[2]


(iii) Calculate the percentage change in pulse rate from 0 minutes to 5 minutes using the data in Table 2.1. 

Give your answer to two decimal places. 

 ............................................................ % [3]


(iv) State the variable that was measured (dependent variable) in this investigation. 

[1]

1b2 marks

The student monitored their pulse rate after exercise on three separate days and calculated their average pulse rate from the data they collected. 

The results are shown in Table 2.2. 

Table 2.2

time after exercise /minutes

pulse rate /beats per minute

average pulse rate /beats per minute

day 1

day 2

day 3

0

156

154

158

156

1

108

107

106

107

2

78

80

76

78

3

66

67

65

66

4

62

120

64

63

5

62

60

61

61

Explain why the student correctly calculated the average pulse rate at 4 minutes after exercise as 63 beats per minute rather than 82 beats per minute.

1c3 marks

Fig. 2.1 shows a cross-section of an artery and a vein as seen using a light microscope.

Microscopic image of artery and vein cross-sections; artery has thick muscular wall, vein has thinner wall. Text labels indicate each structure.

State one visible similarity and two visible differences between the artery and the vein shown in Fig. 2.1.

Did this page help you?