Water samples at three locations, A, B and C, in the reservoir were analysed for pH value and sulfate concentration every month for three years. Samples of clean drinking water were also analysed.
Table 2.1 shows the results.
Table 2.1
water source | pH | sulfate concentration
/mg per litre |
min | max | mean | min | max | mean |
A | 4.6 | 5.5 | 5.2 | 6.2 | 15.5 | 10.4 |
B | 4.5 | 6.1 | 5.5 | 3.8 | 10.0 | 6.9 |
C | 4.7 | 5.3 | 5.0 | 11.3 | 580.2 | 14.2 |
drinking water | 7.1 | 7.3 | 7.2 | 3.2 | 3.4 | 3.3 |
(i) Calculate the pH range for water source B.
range = ......................................................... [1]
(ii) Suggest why the maximum value recorded for sulfate concentration at water source C was not used to determine the mean value.
[1]
(iii) Use the mean data in Table 2.1 to write a conclusion about the water in the reservoir.
[2]
(iv) The water samples from the reservoir are collected in bottles.
Suggest why each bottle is filled and then emptied with water from the reservoir six times before the final sample is taken.
[1]
(v) The sample bottles are labelled with the:
Suggest two other details that should be recorded to ensure the results are comparable.
[2]
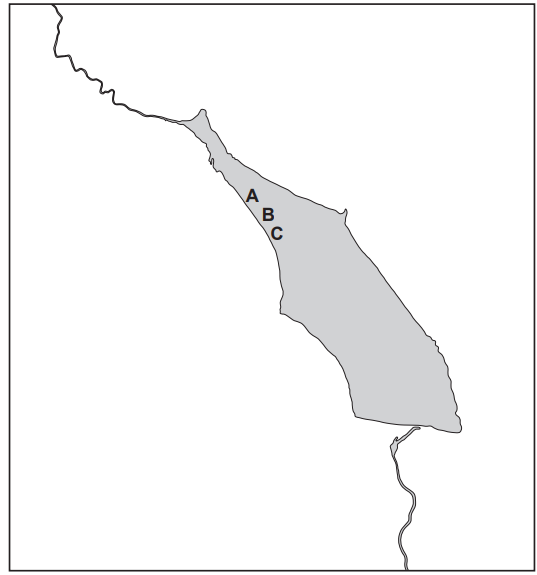
(vi) Fig. 2.1 is a diagram of the Sous reservoir with the three locations, A, B and C, marked.
Fig. 2.1
Suggest how the sampling of water from the reservoir can be improved.
[2]