Cells & Movement Across Membranes (WJEC GCSE Biology): Exam Questions

Exam code: 3400

53 mins5 questions
1a2 marks

Protease and lipase are enzymes that are added to biological washing powders to help break down stains on clothing.

Complete the sentences below by stating the two types of molecules that the enzymes in the biological washing powders help to break down.

Protease breaks down ………………..................................…………………. .

Lipase breaks down ………………..................................…………………. .

1b5 marks

Students designed an experiment to test the effect of temperature on the activity of these enzymes in biological washing powder. They used the following method:

  • Stain five pieces of fabric with egg.

  • Set up five beakers of water at 20°C, 30°C, 40°C, 50°C and 60°C.

  • Add biological washing powder to each beaker.

  • Add a piece of stained fabric to each beaker and leave for 5 minutes.

  • Remove the samples of fabric and compare the stain remaining.

The method and results of the experiment are shown in Image 6.1.

Image 6.1

Diagram showing stained cloths immersed in water with biological washing powder at 20°C, 30°C, 40°C, 50°C, and 60°C. Stains fade with higher temperatures after 5 minutes.

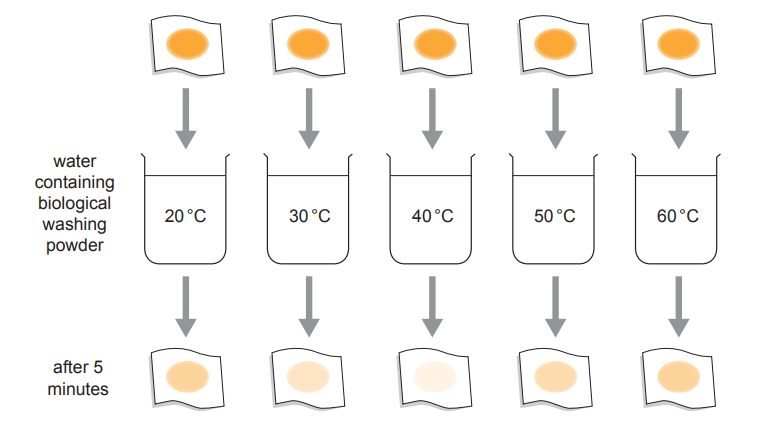
(i) Suggest the best temperature to wash clothes using this biological washing powder. Use the results in Image 6.1 to give the reason for your answer.

[2]

Temperature …………….................... °C Reason

(ii) Use your knowledge of enzymes to explain the result at 60°C.

[3]

1c4 marks

The students repeated the experiment using the same method but using non-biological washing powder which does not contain enzymes. Their results are shown in Image 6.2.

Image 6.2

Five rectangles with a circle inside each, depict colour changes from darker to lighter orange at increasing temperatures: 20°C, 30°C, 40°C, 50°C, 60°C.

(i) Describe the results with the non-biological washing powder.

[1]

(ii) State why they repeated the experiment using non-biological washing powder.

[1]

(iii) Use the results of both experiments to explain the advantage to the environment of adding enzymes to washing powder.

[2]

1d2 marks

Suggest two variables which should have been controlled in this method.

24 marks

Image 2.1 shows a sample of human blood as seen through a light microscope.

Image 2.1

Microscopic image of a phagocyte with a lobed nucleus, surrounded by several red blood cells, labelled accordingly.

(i) The drawing in Image 2.2 shows the cell membrane of the phagocyte.

I. Draw the nucleus in the outline of the phagocyte and label it.

[1]

II. Label the cytoplasm in the outline of the phagocyte.

[1]

Image 2.2

Irregular closed loop with two small crosses marked along the curve on a white background.

(ii) I. Measure the width x–x in mm on the drawing.

[1]

Width x–x = ..................................................................... mm

II. The width of the actual cell is 0.012 mm.
Calculate the magnification of the drawing using the equation below.

[1]

Equation showing magnification as width x-x on drawing divided by width of the actual cell.

magnification = × .....................................................................

3a1 mark

Enzymes are described as biological catalysts. State the function of enzymes in cells. [1]

3b8 marks

Gelatine is a protein which is liquid above 25ºC. The gelatine protein sets when it cools down and becomes fully solid at 15ºC. The gelatine protein does not set if it is broken down by an enzyme. Image 6.1 shows a packet of gelatine.

Image 6.1

Packet of Dr. Oetker Gelatine featuring images of fruit jelly and a cake with cream and fruit layers, labelled "Gold extra."

Many fruits have protease enzymes which break down proteins.

In an investigation some students used the gelatine protein to identify which fruits contain proteases.
They set up five test tubes, one of which is shown in Image 6.2.

Image 6.2

Test tube with blue liquid gelatine protein, containing a labelled small piece of fruit floating inside.

They placed all the tubes in a refrigerator at 5ºC for some time. They then observed the tubes. Their results are shown in Table 6.3.

Table 6.3

Gelatine protein (liquid or solid)

Tube number

Fruit

At start

At end

1

fresh figs

liquid

liquid

2

fresh strawberry

liquid

solid

3

fresh kiwi fruit

liquid

liquid

4

boiled peaches

liquid

solid

5

fresh pineapple

liquid

liquid

(i) Use the information about gelatine and Table 6.3 to answer the following questions.

I. Identify all the fruits which contain protease.

[1]

II. Explain why you reached this conclusion.

[2]

(ii) The students’ teacher commented that the result for peaches was not valid.

I. Explain the reason for this comment.

[2]

II. State how they could obtain a valid result for peaches.

[1]

(iii) Suggest a temperature at which gelatine should be kept before pouring it into the test tubes.

[1]

..................................................................... ºC

(iv) State one variable, other than temperature, which the students should have controlled to ensure fair testing.

[1]

4a2 marks

Catalase is an enzyme found in most cells. Catalase speeds up the breakdown of hydrogen peroxide to form water and oxygen.
Image 9.1 represents the breakdown of hydrogen peroxide by the action of catalase.

Image 9.1

Diagram showing catalase (blue) reacting with hydrogen peroxide (orange), forming a complex, then breaking into water and oxygen, leaving catalase unchanged.

(i) State the name of the structure labelled X in Image 9.1.

[1]

(ii) State the name of the model of enzyme action shown in Image 9.1.

[1]

4b9 marks

Image 9.2 represents the effect of copper sulfate on catalase. If a copper sulfate molecule binds to catalase it prevents it from working.

Image 9.2

Diagram showing catalase enzyme in blue with shapes for active sites, interacting with orange hydrogen peroxide and red copper sulphate.

Students investigated the effect of copper sulfate on catalase activity in potatoes.

The students set up the following four flasks. as shown in Image 9.3.

Image 9.3

Four flasks labelled A to D contain varying combinations of hydrogen peroxide, water or copper sulphate, and fresh or boiled potato pieces.

The students measured the volume of gas produced from each flask using the apparatus shown in Image 9.4.

Image 9.4

Diagram of a laboratory setup showing a flask with potato pieces and hydrogen peroxide, connected by tubing to an inverted measuring cylinder in a water trough.

The results of the investigation are shown in Table 9.5.

Table 9.5

Table showing gas volume in cylinders over time. Flask A increases to 38 cm³, Flask C rises to 14 cm³, while Flasks B and D remain at 0 cm³.

(i) Describe and explain the results for flask A.

[4]

(ii) The rate of gas production in flask A between 10 and 15 minutes is 1.6cm3/min. Calculate the rate of gas production between 10 and 15 minutes in flask C.

[2]

Rate of gas production = ......................................................... cm3/minute

(iii) Use the information in Image 9.2 to explain why less gas is produced in flask C than in flask A.

[3]

4c4 marks

(i) State the purpose of flasks B and D in Image 9.3.

[1]

(ii) State two variables that should have been controlled in this investigation to make it a fair test.

[2]

(iii) Describe how the students could improve the accuracy of their investigation.

[1]

5a5 marks

The following experiment was used to study the movement of water in and out of cells.

  • A glass thistle funnel was half filled with sucrose solution.

  • The bottom of the thistle funnel was closed by a selectively permeable membrane.

  • The thistle funnel was placed in a beaker containing distilled water. As shown in Image 5.1.

  • The level of sucrose solution in the glass tube was marked.

  • The apparatus was left for 30 minutes and then the level of the sucrose solution in the glass tube was measured.

  • The distance the sucrose solution had moved was calculated.

  • If the level of the sucrose solution went up, the number was recorded as a positive number, but if the level of the sucrose solution went down, the number was recorded as a negative number.

  • The experiment was repeated by placing the thistle funnel in salt solutions of 0.2, 0.3, 0.6 and 0.8mol/dm3 .

Image 5.1

Diagram of an osmosis experiment with a thistle funnel containing sucrose solution in a beaker of water, separated by a permeable membrane.

The results of the experiment are shown in Table 5.2.

Table 5.2

Salt concentration (mol/dm3 )

Change in level of the sucrose solution in tube (mm)

0.0 (distilled water)

+36

0.2

+23

0.3

–7

0.6

–17

0.8

–23

Use the results from Table 5.2 to produce a line graph on Graph 5.3 below. The scale and label for the y axis have been completed for you, along with the origin for the x axis

Graph 5.3

Graph with y-axis labelled "Change in level of sucrose solution in tube (mm)" ranging from -40 to 40, with grid lines for precise measurement.
5b7 marks

(i) Explain why the sucrose solution moved up the glass tube when the thistle funnel was placed in distilled water.

[4]

(ii) Use Graph 5.3 to estimate the concentration of the sucrose solution in the thistle funnel.

[3]

Concentration ................................................ mol/dm3

Explain your answer in terms of water movement at this concentration.