Respiration & the Respiratory System in Humans (WJEC GCSE Biology): Exam Questions

Exam code: 3400

1 hour8 questions
1a2 marks

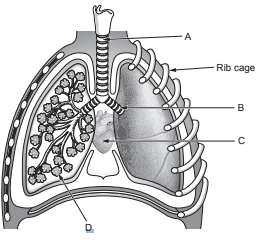
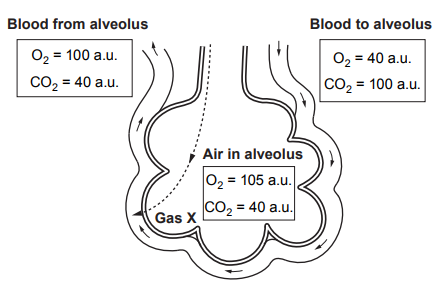
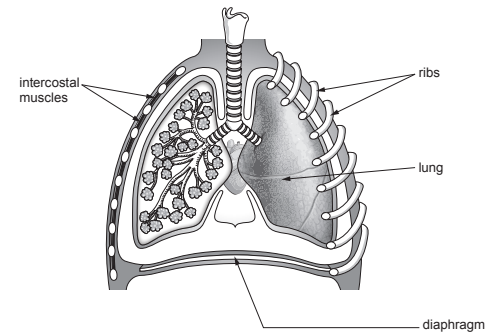
Image 2.1 shows a part of the respiratory system where gas exchange takes place.

Image 2.1

Diagram of alveoli structure showing a curved layer labelled X, inner capillaries labelled Y with circular cells, and arrows indicating air flow.

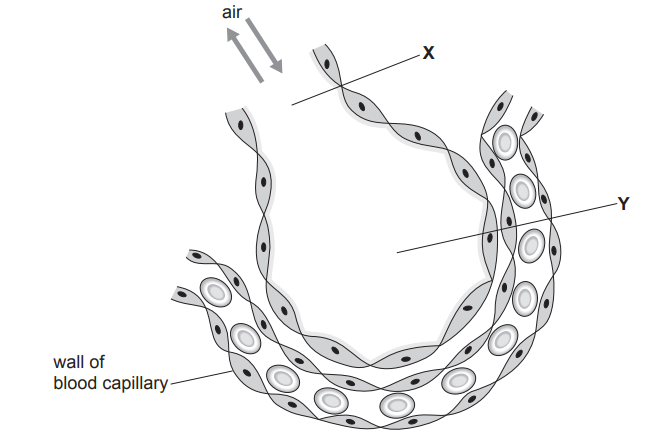
Name structures X and Y in Image 2.1. Choose words from the list below.

bronchus alveolus bronchiole trachea

X ……………….........................................……..

Y ……………….........................................……..

1b5 marks

(i) Underline the correct term from the brackets to complete each of the following sentences:

[3]

I. The gas that moves from the air into the bloodstream is

( carbon dioxide / oxygen / nitrogen ).

II. The process that describes how the gas moves from the air into the bloodstream is

( respiration / osmosis / diffusion / photosynthesis ).

III. The process that releases energy in cells is

( respiration / osmosis / diffusion / photosynthesis).

(ii) Describe two ways that the part of the respiratory system shown in Image 2.1 is adapted for gas exchange.

[2]

1c3 marks

Table 2.2 shows the percentage of gases in inspired and expired air

Table 2.2

Gas

Inspired air (%)

Expired air (%)

Nitrogen

78

...............

Oxygen

21

...............

Carbon dioxide

...............

4

Complete Table 2.2 by adding the missing percentages to the empty boxes from the list below:

0.04 16 78 21 4

2a2 marks

Image 3.1 is a vertical section through the human chest cavity (thorax).

Image 3.1

Diagram of the human respiratory system showing trachea, bronchi, lungs, rib cage, and diaphragm, with parts labelled A, B, C, and D.

Choose the letter (A-D) from Image 3.1 which shows

[2]

(i) a bronchus

(ii) an alveolus

2b7 marks

The way in which the respiratory system works during breathing can be demonstrated using the bell-jar model shown in Image 3.2.

Image 3.2

Diagram showing a bell jar with two balloons inside, a tube at the top, and a rubber sheet below being pulled, demonstrating lung function.

(i) State the part of the model shown in Image 3.2 which represents:

[3]

I. the diaphragm ........................................................................

II. the lungs  ........................................................................

III. the trachea ........................................................................

(ii) The rubber sheet can be pulled downwards to demonstrate inspiration (breathing in).

Complete each of the sentences below by circling the correct statement to describe the process of inspiration in the human thorax.

[2]

The volume of the thorax increases / decreases / stays the same.

The pressure in the thorax increases / decreases / stays the same

(iii) Describe how the ribcage moves during inspiration and why this cannot be demonstrated using the bell jar model.

[2]

2c1 mark

Human muscle cells usually carry out aerobic respiration. During strenuous exercise, however, anaerobic respiration occurs.

State the harmful chemical substance produced by anaerobic respiration in human muscle cells.

3a2 marks

A study of cilia length in the cells lining the bronchioles of 15 non-smokers and 15 smokers was carried out. The results are shown in Graphs 4.1 and 4.2.

Two graphs: Bar graph shows mean cilia length (µm) similar for non-smokers and smokers. Line graph depicts cilia length variation; non-smokers' peak is higher.

Image 4.3 shows three of the cells that line the bronchiole.
Image 4.3 – Cells lining the bronchioles.

Three adjacent, grey, rectangular ciliated cells are shown, labelled A and B. The cells have nuclei and multiple mitochondria, with cilia on the top surface.

Describe the function of cilia in the human respiratory system and the effect of smoking on them.

3b3 marks

(i) Measure the length of line A–B on Image 4.3.

[1]

length A–B = ......................................................... mm

(ii) The actual value of A–B in Image 4.3 is 5μm. Calculate the magnification of the drawing. (1mm = 1000μm)

[2]

magnification = × .........................................................

3c3 marks

(i) Using the information from Graphs 4.1 and 4.2, state two conclusions you can make about the effect of smoking on the length of cilia.

[2]

(ii) Suggest one way in which you could improve the confidence in your conclusions.

[1]

4a2 marks

Image 6 shows gas exchange taking place between an alveolus and a blood capillary. The numbers shown represent the concentrations of oxygen (O2) and carbon dioxide (CO2) in arbitrary units (a.u.)

Image 6

Diagram of alveoli gas exchange showing blood to alveolus (O₂ 40 a.u., CO₂ 100 a.u.), blood from alveolus (O₂ 100 a.u., CO₂ 40 a.u.), and air in alveolus (O₂ 105 a.u., CO₂ 40 a.u.).

State one way in which the alveolus and capillary are adapted to their function.

Adaptation of alveolus

Adaptation of capillary

4b3 marks

Using Image 6, name gas X and use the data to explain how this gas moves from the air in the alveolus into the blood.

5a4 marks

A scientist was investigating changes in lactic acid concentration in the blood of two students, Cerys and Blodwen. They both ran on a treadmill at the same speed for the same time.

Table 4.1 shows the results for Cerys.

Table 4.1

Time (minutes)

Concentration of lactic acid (mg per dm3 )

0

60

10

120

20

180

30

200

40

150

50

110

60

70

70

60

(i) Complete Graph 4.2 of these results by:

  • Plotting the concentration of lactic acid for Cerys

[2]

  • Joining your plots with a ruler.

[1]

The first three plots for Cerys and all the plots for Blodwen have been done for you.

(ii) From Graph 4.2, describe one difference between the results for Cerys and Blodwen.

[1]

Graph 4.2

Graph showing lactic acid concentration over time with two phases labelled 'Cerys' and 'Blodwen', peaking at 30 minutes before declining.
5b2 marks

Use Graph 4.2 to:

(i) calculate the maximum increase in lactic acid in the blood for Blodwen;

[1]

Increase = .................................... mg per dm3

(ii) suggest what time Blodwen stopped running.

[1]

Time = ....................................minutes

5c2 marks

The students are using anaerobic respiration for part of the time they are running. Complete the word equation for anaerobic respiration.

........................................................................... (+ energy)

5d2 marks

The students continued to breathe deeply and rapidly after they had finished running. Explain the reason for this.

6a2 marks

Graph 6.1 shows the relationship between smoking cigarettes and the risk of developing lung cancer.

Graph 6.1

Graph showing lung cancer risk increasing with years smoking. Risk rises faster for smoking more cigarettes per day, with 20+ cigarettes having the highest risk.

State two conclusions that can be drawn from Graph 6.1.

6b2 marks

State one chemical found in cigarette smoke and its effect on the body.

[2]

Chemical......................................................................................................

Effect............................................................................................................

6c5 marks

Image 6.2 shows the cells that line the airways of the lungs

Image 6.2

Diagram of epithelial cells with cilia and mucus. Cells have blue dots near the top, cilia extend above a blue mucus layer. Labels highlight cilia and mucus.

(i) Describe the function of:

I. mucus;

[1]

II. cilia.

[1]

(ii) Describe the effect of smoking on the cilia and mucus.

[2]

(iii) Other than lung cancer, state the name of one disease which can be caused by cigarette smoking.

[1]

7a3 marks

The experiment shown in Image 4.1 was set up to investigate respiration in germinating peas.

Image 4.1

Diagram of a scientific setup showing three thermos flasks with peas and temperature sensors connected to a data logger and a laptop.

The flasks all contained an equal mass of peas. Table 4.2 shows the treatment that each flask received:

Table 4.2

Flask

Treatment

A

Germinating peas soaked in disinfectant.

B

Germinating peas which had been boiled for 30 minutes then soaked in disinfectant.

C

Germinating peas which had been boiled for 30 minutes.

The temperature of the flasks was monitored for 120 hours.

The results of the experiment are shown below in Graph 4.3.

Graph 4.3

Graph showing temperature changes over 120 hours for flasks A, B, and C. Flask A rises to 50°C, flask B stays at 20°C, flask C rises to 35°C.

(i) State the purpose of soaking the peas in disinfectant in flasks A and B.

[1]

(ii) Explain the results for flask A between 0 and 24 hours.

[2]

7b1 mark

Explain how flask B acts as a control experiment for flask A.

7c1 mark

Aerobic respiration of one molecule of glucose releases 38 molecules of ATP. State whether the number of molecules of ATP produced from anaerobic respiration would be higher or lower than 38. Give a reason for your answer.

8a3 marks

Popcorn lung is a lung disease which results in scarring and inflammation of the bronchioles. Symptoms of the disease are coughing and difficulty breathing. Image 9.1a and 9.1b show a healthy bronchiole and a bronchiole affected by popcorn lung.

Side-by-side diagrams show a healthy bronchiole and a bronchiole affected by popcorn lung, illustrating structural changes and narrowing.

A chemical called diacetyl is used in the manufacture of popcorn. A link between inhaling diacetyl and the lung disease was made when a group of workers from a popcorn factory was found to have developed the disease.

In the US there have been increasing numbers of cases of popcorn lung linked to the use of e-cigarettes. There are around 7700 flavours for e-cigarettes sold in the US. A single study of 51 e-cigarette flavours in 2016 found that 39 contained diacetyl. Diacetyl was banned in e-cigarette flavourings in the UK in 2016.

In 2019, a report in the journal Nature showed that diacetyl reduced the number of ciliated

Image 9.2 shows the human respiratory system

Image 9.2

Illustration of human thoracic cavity showing labelled ribs, intercostal muscles, lungs, diaphragm, and trachea with alveoli detail on one lung.

(i) Use a labelled arrow to identify an alveolus on Image 9.2.

[1]

(ii) State two ways in which the alveolus is adapted for gas exchange.

[2]

8b3 marks

Explain why a person affected by popcorn lung shows the following symptoms:

(i) coughing.

[1]

(ii) breathing difficulties.

[2]

8c2 marks

Use the information given to evaluate the validity of the following conclusion: ‘E-cigarette flavours cause popcorn lung’.