Digestion & the Digestive System in Humans (WJEC GCSE Biology): Exam Questions

Exam code: 3400

53 mins5 questions
1a3 marks

Table 3.1 shows a nutritional information label from a packet of crisps.

Table 3.1

Nutritional table for crisps with values per 25g and 100g: energy, protein, carbohydrate (missing), fat, fibre. Crisps pictured on the left.

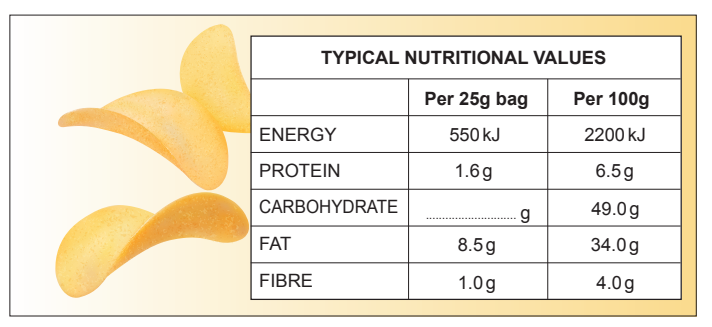
(i) Complete the missing value on Table 3.1 by calculating the mass of carbohydrate per 25g bag. Give your answer to one decimal place.

[2]

(ii) State the use of carbohydrate in the body.

[1]

1b3 marks

A 6-year-old child ate two bags of these crisps.

(i) Calculate the total mass of fat in the crisps that the child consumed.

[1]

Total mass of fat = …. . . . . . . . . . . . . .…… g

(ii) That day, the child consumed more than the guideline daily amount of fat.

State two health problems of regularly consuming too much fat.

[2]

1c3 marks

A student used the apparatus shown in Image 3.2 to measure the energy content of the crisps. She measured the temperature of the water before and after burning the crisp.

Image 3.2

A test tube with water is clamped to a stand, positioned above a burning crisp on a heatproof mat, depicting a heat transfer experiment.

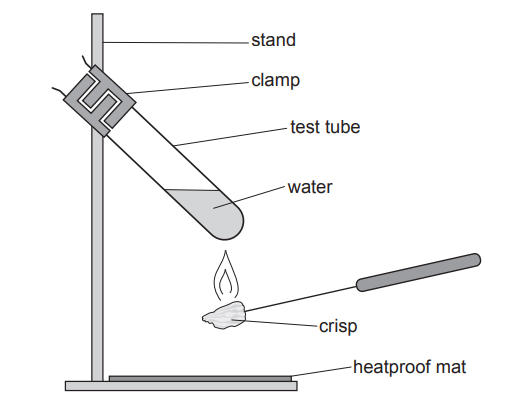
(i) State two safety precautions the student should have taken when carrying out the investigation.

[2]

(ii) State the piece of apparatus missing from Image 3.2 that is needed for the student to be able to measure temperature.

[1]

1d4 marks

The temperature of water was 20°C before burning the crisp and 41°C after burning the crisp.

(i) Calculate the temperature rise of the water.

[1]

Temperature rise = .......................... °C

(ii) The crisp weighed 0.5g and the mass of water she used was 20g. Use the following equation and your answer from (d)(i) to calculate the energy (J) per gram of the crisps.

[2]

Equation for calculating energy released per gram of food: water mass times temperature rise times 4.2, divided by food sample mass.

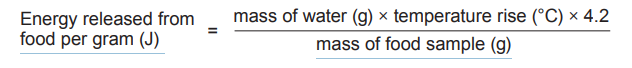
Energy released from food per gram = ................................ J

(iii) The energy value that the student calculated was much lower than the energy value stated on the packet.

Suggest the reason for this.

[1]

2a4 marks

Image 4.1 shows part of the digestive system in a human.

Image 4.1

Diagram showing liver, gall bladder, and small intestine. Labels: A - tube, B - large round organ, C - intestine. Arrows point to each organ.

(i) State the letter (A-C) which shows the pancreas.

[1]

(ii) The pancreas produces lipase.

Complete the sentence below using one of the terms given.

glucose glycerol amino acids

Lipase breaks down fat into fatty acids and ......................................

[1]

(iii) The breakdown of fat by lipase is assisted by bile.
Using Image 4.1 describe the pathway taken by bile as it passes from the liver, where it is produced, to where it enters the small intestine.

[2]

2b8 marks

In an investigation, the effect of lipase on the breakdown of fat was measured with and without using bile.
Five trials were carried out and the results are shown in Table 4.2 and Graph 4.3.

Table 4.2

Table comparing lipase activity in five trials with and without bile, showing activity means of 24.0 with bile and 3.0 without, and ratio of means.

(i) I. Calculate the ratio of the means. Write your answer in Table 4.2.

[1]

II. Complete Graph 4.3 by plotting the results for trial 4 and trial 5 from Table 4.2. [3]

Graph 4.3

Bar chart comparing lipase activity in trials with bile and without bile. Three trials show higher activity with bile (white) than without bile (grey).

(ii) From these results, describe the effect of bile on the activity of lipase and give one piece of evidence to support your answer.

[2]

(iii) Each trial started at pH 7. State how the pH would change during the trial.

[1]

(iv) State the purpose of measuring the activity of lipase without bile in each of the trials.

[1]

3a2 marks

Image 3.1 shows the human digestive system.

Image 3.1

Diagram of human digestive system viewed from the side, showing organs like the liver and intestines; labels A and B point to stomach and intestines.

Label parts A and B on Image 3.1.

3b4 marks

A length of Visking tubing was used to model a part of the digestive system. The Visking tubing was filled with a solution of starch and protein. The apparatus was kept at a temperature of 35ºC. The apparatus is shown in Image 3.2.

Image 3.2

A hand injecting protease into a Visking tubing containing starch and protein solution, submerged in a container of water.

A sample of the water surrounding the Visking tubing was tested for protein, starch, amino acids and glucose at the start of the experiment. After 15 minutes, protease was injected into the Visking tubing. After 30 minutes, the water surrounding the Visking tubing was tested again.

(i) Describe how you would use a chemical to test the water for the presence of glucose.

[2]

(ii) Complete Table 3.3 below to show the expected results for this experiment. One column has been done for you.

√ = present in the water surrounding the Visking tubing

× = absent in the water surrounding the Visking tubing

[2]

Table 3.3

Time /minutes

Starch

Protein

Amino acids

Glucose

0

x

30

x

3c2 marks

Suggest which part of the digestive system shown in Image 3.1 is represented by the Visking tubing. Give a reason for your answer.

4a6 marks

An experiment was set up using Visking tubing as a model gut. The Visking tubing was filled with a solution containing starch and the enzyme amylase

Image 7.1

Visking tubing in a test tube contains starch solution with 1% amylase, surrounded by water, demonstrating a semi-permeable membrane experiment.

The water surrounding the Visking tubing was tested for starch and glucose at the start and at 30 minutes. The results are shown in Table 7.2.

Table 7.2

Substance

At start

At 30 minutes

glucose

absent

present

starch

absent

present

Describe the chemical tests for starch and glucose. Explain the results obtained in this experiment at 30 minutes.

4b5 marks

Image 7.3 shows the human digestive system.

Image 7.3

Diagram of the human digestive system, showing labelled organs including the liver (A), stomach (B), pancreas (C), intestines (D), gallbladder (E), and oesophagus (F).

(i) State the letter of the organ (A–F) where bile is:

[2]

I. made; ..............................

II. stored. ..............................

(ii) Explain the function of bile in the digestion of fat.

[2]

(iii) State the name of the organ where digestion of fat takes place.

[1]

5a4 marks

Image 3.1 shows the human digestive system.

(i) Draw an arrow labelled P on Image 3.1 to show an organ where only protein is digested.

[1]

(ii) Draw an arrow labelled B to show an organ where fat and oil (lipids) are digested.

[1]

Image 3.1

Outline of a human figure showing the digestive system, including the oesophagus, stomach, intestines, liver, pancreas, and gallbladder.

(iii) State the purpose of digestion.

[2]

5b5 marks

Image 3.2 shows part of a starch molecule being digested by carbohydrase in the mouth.

Image 3.2

Diagram of enzyme action in three stages showing a carbohydrase enzyme breaking down a starch molecule into smaller components with active site labelled.

(i) State the name of structure A, indicated by the box in stage 2.

[1]

(ii) State the name of the molecule produced by the digestion of starch and describe one way in which it is used by the body.

[2]

(iii) Describe and explain what will happen to the active site of the carbohydrase enzyme when it is inside the stomach.

[2]