Plants & Photosynthesis (WJEC GCSE Biology): Exam Questions

Exam code: 3400

47 mins5 questions
1a3 marks

Image 8.1 shows a fertiliser that is used when growing tomato plants.

Image 8.1

Illustration of a plastic bottle labelled "Tomato Fertiliser" with images of whole and sliced tomatoes on the front, featuring a red cap.

State three nutrients that this fertiliser may contain.

1b2 marks

Tony grows tomato plants in his greenhouse. He designed an investigation to see if using fertiliser made a difference to the mass of his tomatoes. He grew one tomato plant adding the fertiliser once a week and left one plant without fertiliser. After three months he measured the mass of 10 tomatoes from each plant.

Identify the independent and dependent variables for the investigation.

Independent variable ……….........................................………...............................…….. Dependent variable ……….........................................………...............................……..

1c4 marks

Table 8.2 shows the results for the experiment.

Table 8.2

Table comparing tomato mass with and without fertiliser. Mean mass with fertiliser: 35g; without: 29g. Masses listed for ten tomatoes each.

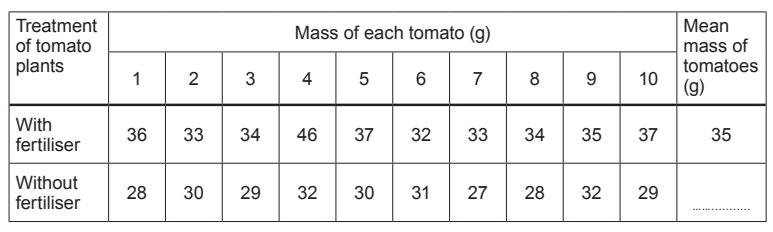
(i) Tony calculated the mean mass of tomatoes grown with fertiliser without including an anomalous result.

Circle the anomalous result in Table 8.2.

[1]

(ii) Calculate the mean mass of tomatoes grown without fertiliser. Write your answer in Table 8.2 to the nearest whole number.

[2]

Space for working:

(iii) State the conclusion that Tony can make from the results in Table 8.2.

[1]

1d3 marks

(i) Tony ensured that this investigation was a fair test. State one variable that Tony would have controlled.

[1]

(ii) Each tomato plant produced many tomatoes, from which Tony chose ten.

Suggest why this step in Tony’s method could have caused inaccuracies in his results, and what he could have done to improve the investigation.

[2]

Reason for inaccuracies

Suggestion for improvement

2a1 mark

Part of a plant root is shown in Image 8.1.

Image 8.1

Diagram of a plant root showing root hairs and two labelled zones, A and B, with arrows pointing to root hairs near zone A.

Explain why water uptake in zone A is greater than in zone B.

2b5 marks

Image 8.2 represents a section through the leaf of a plant.

Image 8.2

Cross-section diagram of a leaf showing labelled parts: cuticle, upper epidermis, palisade and spongy mesophyll, vascular bundle, stoma, guard cells.

(i) On Image 8.2, draw an arrow to show the tissue which transports water to all parts of the plant. Label the arrow with the name of the tissue.

[2]

(ii) I. Name cells X shown in Image 8.2.

[1]

II. State how the stoma and cuticle are involved in the control of water loss from a leaf.

[2]

Stoma

Cuticle

2c6 marks

Megan and Rhys investigated the loss of water from a leafy shoot. They used the apparatus shown in Image 8.3.

Image 8.3

Diagram showing a plant shoot in a beaker on a balance, with a fan blowing air onto it. Water is covered by oil, displayed weight is 85.9g.

They recorded the loss of mass after directing moving air, at different speeds, onto the shoot.

(i) State the scientific term for the evaporation of water from the leaves of a plant.

[1]

(ii) State one way in which Megan and Rhys could ensure that they carried out a fair test.

[1]

(iii) State why it was important that the layer of oil was added.

[1]

(iv) The results of their investigation are summarised in Graph 8.4.

Graph 8.4

Graph showing the rate of water loss increasing with air speed from 3 to 9 m/s. Rate in arbitrary units, speed in metres per second.

I. Describe the effect of increasing the speed of moving air on the rate of water loss.

[2]

II. Sketch a line on Graph 8.4 to suggest the result you would expect if the humidity of the air was increased.

[1]

3a3 marks

Images 2.1A, 2.1B and 2.1C show a root hair cell, xylem and phloem, and a leaf

Diagram of a root hair cell, labelled parts; xylem and phloem vessels, structural detail; and a green leaf, showing general shape and texture.

Images are not to scale.

Complete Table 2.2 by matching the parts of the plant to their functions, A–D shown below.

A – transports sucrose around the plant

B – absorbs water from the soil

C – transports water in the plant

D – absorbs light for photosynthesis

Table 2.2

Part of plant

Function (A–D)

root hair cell

.....................

xylem

.....................

phloem

.....................

leaf

.....................

3b3 marks

Complete the following sentences by choosing some of the words below.

similar cells different organ organism specialised

A root hair cell is an example of a ................................................... cell. Xylem and phloem are both tissues. Tissues are groups of similar ................................................... with a similar function. A leaf is an ................................................... which is made up from different tissues working together.

4a3 marks

Students were instructed to investigate the effect of temperature on photosynthesis. They used the apparatus shown in Image 8.1.

Image 8.1

Diagram of a photosynthesis experiment with a lamp, thermometer, beaker, water bath, water plant, and sodium hydrogen carbonate solution. Bubbles are shown.
  • The number of bubbles of gas produced by the water plant per minute was counted at different temperatures.

  • The experiment was carried out three times at each temperature.

  • The results are shown in Table 8.2. Means were calculated to the nearest whole number.

Table 8.2

Temperature of water bath (°C)

Number of bubbles of gas produced per minute

Test 1

Test 2

Test 3

Mean

20

18

21

12

17

25

15

24

21

20

30

24

27

30

27

35

26

25

26

26

40

14

13

10

12

45

3

5

6

..............

50

0

0

0

0

(i) State the name of the gas produced during photosynthesis.

[1]

(ii) State two ways in which plants use the glucose produced during photosynthesis.

[2]

4b6 marks

(i) Calculate the mean number of bubbles per minute for 45°C. Write your answer in Table 8.2.

[2]

(ii) Describe the relationship between the temperature and the number of bubbles produced per minute.

[2]

(iii) Explain the result for 50°C.

[2]

5a3 marks

Julius von Sachs was a 19th century German scientist who studied the effect of plant nutrients on growth. He developed a growth solution which contained all the nutrients a plant needed for healthy growth.

A version of one of his experiments is shown below.

1. Seedlings of the same age were placed on cotton wool in four test tubes, each containing an equal volume of a different nutrient solution.

2. All four test tubes were placed on a shelf in full sunlight.

3. The growth of the seedlings was observed and recorded after one month (Image 7.1).

Image 7.1

Four tubes with plants grown in water, labelled Tube 1 to Tube 4. Plant health declines progressively from lush green in Tube 1 to wilting in Tube 4.

Tube 1

Tube 2

Tube 3

Tube 4

Content of growth solution

all nutrients present

no nutrient X

no nutrient Y

no nutrient Z

Description of growth after one month

healthy growth

poor root growth

yellowing of leaves

poor growth

Identify the missing nutrients.

Nutrient X = ........................................................................................

Nutrient Y = ........................................................................................

Nutrient Z = ........................................................................................

5b5 marks

Students modified the experiment by taking two seedlings of similar age and placing them in a sealed bell jar as shown in Image 7.2.

Image 7.2

Two bell jars, A and B, each contain a seedling in nutrient solution. Jar B includes a chemical to reduce root respiration. Both jars are sealed.

Image 7.3 shows the appearance of the apparatus after 2 weeks.

Image 7.3

Two glass domes labelled A and B, each containing a plant in water. Condensation droplets form on the inner surfaces of both domes.

(i) Suggest the purpose of the layer of oil in the experiment.

[1]

(ii) Explain the presence of the condensation (water droplets) inside the bell jars in Image 7.3.

[2]

(iii) Using your knowledge of how nutrients are absorbed, explain the difference in growth between the plants in bell jars A and B during the 2 weeks.

[2]