Classification & Biodiversity (WJEC GCSE Biology): Exam Questions

Exam code: 3400

1 hour8 questions
1a5 marks

Table 3.1 shows the classification of three species of badger.

Table 3.1

Species of badger

Classification

European

Honey

Asian

Kingdom

Animal

Animal

Animal

Phylum

Vertebrate

Vertebrate

Vertebrate

Class

Mammal

Mammal

Mammal

Order

Carnivore

Carnivore

Carnivore

Family

Mustelidae

Mustelidae

Mustelidae

Genus

Meles

Mellivora

Meles

Species

meles

capensis

leucurus

(i) State the two species of badger that are most closely related.
Explain your answer.

[2]

(ii) Use Table 3.1 to state the scientific name of the honey badger.

[1]

(iii) State one reason why scientists use scientific names instead of common names for organisms.

[1]

(iv) The honey badger is a vertebrate. State what is meant by the term vertebrate.

[1]

1b2 marks

Image 3.2 is a fact file about the honey badger.

Image 3.2

Honey badger walking on sandy terrain. It has a mottled grey and black coat. Information about its habitat, diet, and predators is detailed below.

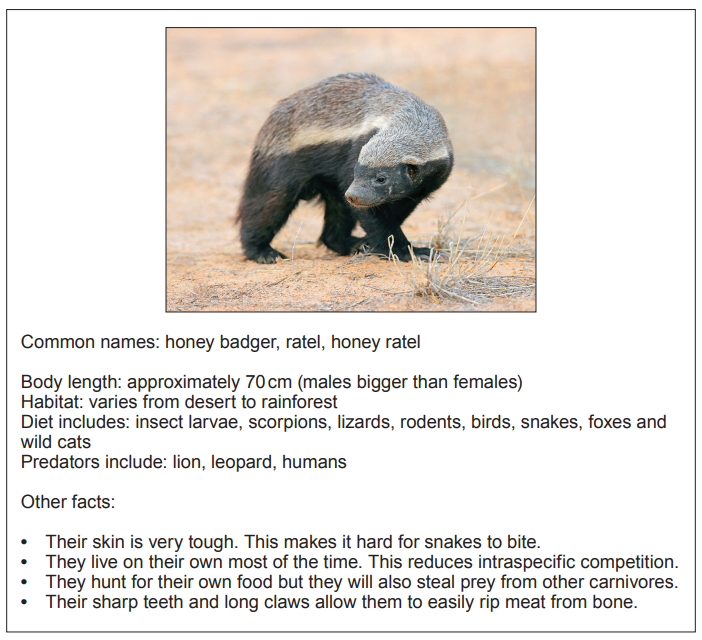
Use the information in Image 3.2 to describe two adaptations of the honey badger. Explain how each helps them survive.

Adaptation

How it helps them to survive

............................................................
............................................................

...........................................................
...........................................................

............................................................
.............................................................

...........................................................
...........................................................

1c2 marks

Suggest what would happen to the number of honey badgers if the number of lions increased. Explain your answer.

1d4 marks

(i) State what is meant by intraspecific competition.

[1]

(ii) List three resources for which all animals compete.

[3]

  1. ...................................

  2. ...................................

  3. ...................................

2a2 marks

The five Kingdom system can be used to classify all living things. Complete the classification chart, Image 4.1, by inserting the names of the two missing Kingdoms.

Image 4.1

Flowchart of living things, showing categories: blank, single-celled organisms (Protictista), blank, plants, and animals.
2b2 marks

In 1825, red pandas were classified as members of the racoon family (Procyonidae). Later, they were classified as members of the bear family (Ursidae). The most recent research has classified red pandas in their own family (Ailuridae). Image 4.2 shows red pandas. Image 4.2

Image 4.2

Two red pandas perched on tree branches, facing each other amidst lush green foliage, with one panda slightly higher than the other.

Suggest the evidence that would have been used in 1825 to classify red pandas.
State the type of evidence available to researchers more recently that resulted in the reclassification of red pandas.

2c4 marks

In 2015, the International Union for Conservation of Nature (IUCN) assessed red pandas as endangered.

Table 4.3 shows the results of studies into population densities of red pandas in five districts of Nepal between 1989 and 2014.

Table 4.3

District

Year of study

Size of area studied (km2 )

Number of red pandas counted

Population density (number/km2 )

Rara

2014

35

11

......

Langtang

1989

142

68

0.48

Panchthar

2004

178

100

0.56

Dhorpatan

2012

Known to be present but no data available

Bhotkhola

2011

41

135

3.29

(i) Calculate the population density of red pandas in the Rara district in 2014.
Write your answer in Table 4.3.

[1]

(ii) In 1991, the population density of red pandas in Langtang had decreased to 0.17 per km2 .
Suggest one reason for the decrease.
State one method by which endangered species could be conserved.

[2]

Reason for decrease
.....................................................................

Method of conservation
.....................................................................

(iii) Using data from Table 4.3, suggest the district in which red pandas have the highest chance of survival. Give a reason for your answer.

[1]

3a3 marks

In the 1980s young terrapins (Trachemys scripta) from North America were sold in pet shops throughout the UK. When the terrapins became adults, many people no longer wanted them and released them into local ponds. The animals can live for up to 50 years.

Young terrapin on a person's hand and adult terrapin on a rock near water, both with distinctive shell patterns and vibrant markings.

Table 4.1

Terrapin age

Body length (mm)

3 months

25

2 years

50

12 years

300

After release, adult terrapins eat native animals including invertebrates and vertebrates such as frogs and fish. In some ponds, native species have been reduced or lost completely.
Since 1992 a law has banned the import of terrapins into the UK.

Use the information to answer the questions.

Complete the classification of the terrapin.

Kingdom ..............................
Phylum Chordates (Vertebrates)
Class Reptiles
Genus .......................................
Species ...................................

3b3 marks

(i) Calculate the increase in body length per year for an adult terrapin in the ten years between 2 years old and 12 years old.

[2]
Increase in body length = ..............................mm/year

(ii) Suggest one reason why some people did not want to keep the terrapins when they became too big.

[1]

3c3 marks

Complete Table 4.2 by writing true or false for each of the statements. One row has been done for you.

Table 4.2

Statement about terrapins in the UK

True / False

They can live for over 60 years.

False

They do not eat animals with backbones.


......................

They have reduced the biodiversity in ponds.


......................

They cannot be brought into the country legally.


.....................

They are an alien species.

......................

3d1 mark

In the USA, these terrapins are called red-eared sliders and in Welsh they are called terapin clustgoch.

State how scientists from different countries ensure that they are all talking about the same species.

4a3 marks

Barnacles are small animals that grow on rocks at the seashore.
Two species of barnacle native to the British Isles, Chthamalus stellatus and Semibalanus ,balanoides are shown in the photographs in Image 7.1.

Image 7.1

Close-up image comparing C. stellatus and S. balanoides barnacles on a rocky surface, showing their distinctive textures and shell patterns.

Students carried out a survey to test the following hypothesis:

C. stellatus is found further up the seashore towards the high water mark.
S. balanoides is found lower down the seashore towards the low water mark.

Image 7.2

Students conducting a survey on a rocky beach with measuring tape, spanning from high to low water mark; labelled distance is 0 to 50 metres.

The students measured the abundance and distribution of barnacles between the high water mark and the low water mark on the seashore. The results of their survey are shown in Table 7.3.

Table 7.3

Distance from high water mark (m)

Number of barnacles

C. stellatus

S. balanoides

0 (high water mark)

0

0

5

13

0

10

28

0

15

36

0

20

52

3

25

57

25

30

29

41

35

17

51

40

0

60

45

0

42

50(low water mark)

0

0

Describe the method the students would have used to measure the abundance and distribution of barnacles between the high and low water mark.

4b5 marks

(i) State two environmental factors which could affect the population of barnacles.

[2]

I. .............................................
II. ............................................

(ii) Calculate the ratio of C. stellatus to S. balanoides at the 25m mark.

[1]

C. stellatus .......................... : S. balanoides ......................................

(iii) State the type of competition occurring between the two species of barnacles at the 25m mark.

[1]

(iv) State whether the results of the survey support the students’ hypothesis (given on page 15). Use the data provided in Table 7.3 to give a reason for your answer.

[1]

5a3 marks

Images 2.1A and 2.1B show the hazel dormouse (Muscardinus avellanarius) in winter and summer.

Two images of a dormouse: left shows it asleep in winter with thick fur; right shows it in summer on a branch with large eyes and grasping feet.
  • Dormice are nocturnal (active only at night).

  • In summer, they live high up in trees and bushes, eating berries and insects.

  • In winter, they hibernate (being completely inactive) and keep warm in nests at ground level.

  • Between the years 2000 and 2020 the dormouse population in the UK decreased and it became an endangered species in some areas.

  • In 2000, as part of a local action plan, 1000 dormice were released into an area and their numbers later increased to 1050.

Use the information to answer the following questions.

State one way in which the dormouse body structure is adapted to:

[3]

(i) survive in low temperatures;

(ii) climb in branches of trees;

(iii) look for food at night.

5b1 mark

State one way in which the behaviour of the dormouse helps it to survive in its environment.

5c4 marks

Using the information, complete the table by writing true or false for each statement.

Statement about the hazel dormouse

True or false

Its habitat is woodland.

true

It eats only plants.

.....................

The species became extinct in the UK in 2020.

.....................

It does not hunt for food in daylight.

....................

As a result of a local action plan, numbers increased by 5%.

....................

It belongs to the genus Muscardinus.

...................

6a1 mark

Limpets (Patella vulgata) are animals without backbones which live on rocky seashores, feeding on plants.

Close-up of several conical-shaped limpets attached to a rough, dark rock surface, highlighting their ridged, textured shells.

State the scientific term for animals which do not have backbones.

6b11 marks

Students investigated the density of limpets (number per m2 ) on two rocky shores in Anglesey. One shore was sheltered and one was exposed to heavy wave action.

Image showing two shores: Left is a sheltered shore with seaweed, right is an exposed shore with bare rocks, both with labels and annotations.

Students’ method:

  • Select a section on each shore of 300m2 .

  • Place quadrats, each of area 1m2 , at 10 random co-ordinates in each of the two shore sections and collect data.

  • Compare the data for the two shores.

(i) Table 6.1 shows one part of the students’ risk assessment for the investigation.

Complete Table 6.1.

[1]

Table 6.1

Hazard

Risk

Control measure

Sharp edges on rocks

.......................................

...................................

(ii) Describe in detail the techniques the students should use to place their quadrats at random and collect data.

[3]

The results of the investigation are shown in Tables 6.2 and 6.3

Table 6.2

Number of limpets on exposed shore:

Quadrat number

1

2

3

4

5

6

7

8

9

10

Mean number per m2

Estimated total number in the 300m2 section of shore

Number of limpets

26

21

22

18

5

21

17

23

19

26

19.8

5940

Table 6.3

Number of limpets on sheltered shore:

Quadrat number

1

2

3

4

5

6

7

8

9

10

Mean number per m2

Estimated total number in the 300m2 section of shore

Number of limpets

30

22

26

31

28

25

23

19

31

26

......

......

(iii) Complete Table 6.3 for the sheltered shore by calculating:

[3]

I. The mean number of limpets per m2 .

II. The estimated total number of limpets in the 300m2 section of the shore.

(iv) I. From these results, state what the students could conclude about the density of limpets when they compared the two shores.

[1]

II. Suggest an explanation for this observation.

[1]

(v) State which of the quadrats (1–10) from the exposed shore shown in Table 6.2 had an anomalous result and describe what should have been done to take account of this.

[2]

7a4 marks

Biological control is used to reduce the numbers of a pest population through the introduction of another species. It has been used with varying success since the 19th century.

(i) State two advantages of this method of control.

[2]

Advantage 1.....................................................

Advantage 2....................................................

(ii) State two disadvantages of this method of control.

[2]

Disadvantage 1...............................................

Disadvantage 2..............................................

7b5 marks

The whitefly (Trialeurodes vaporariorum) is a pest which damages greenhouse crops such as tomatoes. Whitefly numbers can be reduced by using the biological control agent Encarsia formosa.

Encarsia formosa fact file

  • E. formosa is a tiny wasp that lays eggs inside developing whitefly.

  • When the eggs hatch, the young wasps kill the developing whitefly from the inside.

  • Optimal conditions for E. formosa are temperatures over 20°C.

  • When daytime temperatures are less than 17°C, E. formosa activity is significantly reduced, making it less effective.

Graph 7.1 shows the number of whiteflies in a greenhouse containing tomato plants. E. formosa were introduced on day 7.

Graph 7.1

Graph showing the number of whitefly per plant over 60 days. Peaks at day 15 with 65 whitefly, then declines steadily to 15 by day 50.

(i) I. The use of E. formosa to reduce the number of whiteflies is considered to be successful when there are 20 or fewer whiteflies per plant. Use Graph 7.1 to determine how many days it took for the number of whiteflies to fall to 20 following the introduction of E. formosa.

[2]

.................................................. days

II. Suggest a reason why it took this long for the number to fall to 20.

[1]

(ii) Suggest one reason why this method of pest control would not be effective to use if whiteflies damaged wheat crops grown in Wales.

[1]

(iii) An alternative approach to reducing pest numbers is to use pesticide. State why it is not appropriate to use pesticide along with E. formosa.

[1]

83 marks

The yellow crazy ant (Anoplolepis gracilipes) was introduced accidentally to northern Australia. Due to the ecological damage it has caused, it is on a list of “one hundred of the world’s worst invasive species” produced by the International Union for Conservation of Nature (IUCN). The ants build super-colonies that disrupt native habitats.

Yellow crazy ants crawling over leaves and soil, surrounded by white ant eggs, showcasing their natural habitat and behaviour.

(i) State what is meant by the term invasive species.

[1]

(ii) State the genus of the yellow crazy ant.

[1]

(iii) Explain how the formation of super-colonies affects biodiversity.

[1]