Response & Regulation (WJEC GCSE Biology): Exam Questions

Exam code: 3400

2 hours13 questions
1a10 marks

In Type 2 diabetes the body tissues do not respond to insulin.

  • The main risk factors are obesity, lack of regular exercise, family history and age.

  • The condition can be diagnosed by blood tests to measure glucose levels or by testing urine for glucose.

  • There are no drugs that can cure Type 2 diabetes.

  • However, a drug called metformin improves the response of the body tissues to insulin.

(i) Choose words from the list below to fill in the gaps in the sentences.

[4]

liver   pancreas   stomach   glycogen   hormone   starch

Insulin is a .................... that is produced in the ...................... . It travels in the blood to the ....................... and causes glucose to be converted to.........................

(ii) Use the information provided to complete Table 4.1 by writing true or false next to each of the statements.

[4]

Table 4.1

Statement

True/False

Type 2 diabetes is caused by too much insulin being produced.

Metformin works by reducing the response of the body tissues to insulin.

Being overweight is a risk factor for Type 2 diabetes.

Type 2 diabetes can be cured with medication

Only lifestylechoices affect the risk of developing Type 2 diabetes.

(iii) Doctors may prescribe metformin tablets to help treat Type 2 diabetes. Suggest two lifestyle changes the doctor may also advise.

[2]

1b5 marks

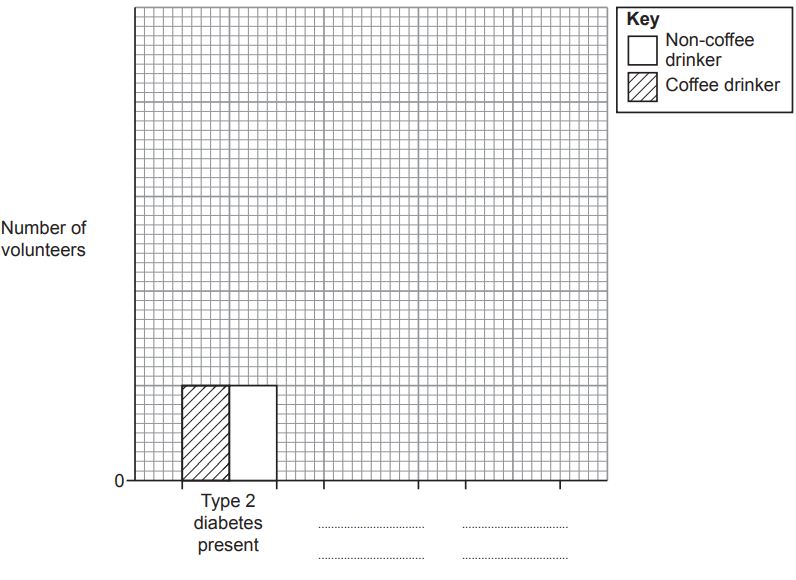
Graph 4.2 shows the number of people with Type 2 diabetes per 1000 of the population between 2014 and 2024.

Graph 4.2

Line graph showing an increase in Type 2 diabetes cases per 1000 people from 2014 to 2024, rising from 3 to 8 cases over the years.

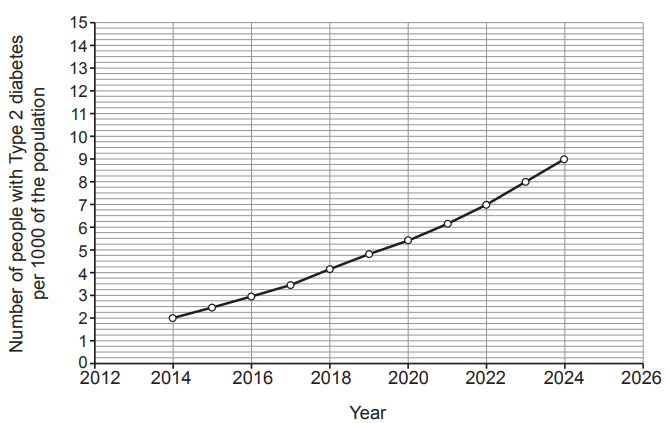
(i) Describe the trend shown in Graph 4.2 between 2014 and 2024.

[1]

(ii) Use the information in Graph 4.2 to calculate the difference in the number of people with Type 2 diabetes per 1000 of the population between 2014 and 2024.

[1]

Difference per 1000 of the population between 2014 and 2024 =...............

(iii) Use your answer to part (b)(ii) and the following equation to calculate the percentage change in the number of people that have Type 2 diabetes per 1000 of the population between 2014 and 2024.

[2]

space Percentage space change equals fraction numerator left parenthesis Difference space in space the space number space of space people space with space Type space 2 space diabetes space in space 2024 space and space 2014 right parenthesis space over denominator left parenthesis Number space of space people space with space Type space 2 space diabetes space in space 2014 right parenthesis space end fraction cross times 100

Percentage change =.................

iv) Use Graph 4.2 to estimate the number of people per 1000 of the population that will have Type 2 diabetes in 2026 if the current trend continues. Show on Graph 4.2 how you arrived at your answer.

[1]

Number of people per 1000 of the population that will have Type 2 diabetes in 2026 =................

1c2 marks

(i) Underline the chemical solution that can be used to test for glucose in urine.

[1]

Biuret reagent   Benedict’s reagent   Iodine

(ii) State what colour the solution would turn if the person had diabetes.

[1]

2a4 marks

A class of year 11 boys were investigating reaction time. The students suggested the following hypothesis:

“Year 11 students have faster reaction times than teachers”

A computer program was used to record the reaction time. Each individual had to press a button on the keyboard when the screen turned green (Image 8.1). Each individual had three attempts and the mean value was recorded.

Image 8.1

Illustration of a person sitting in a red chair at a desk, typing on a keyboard, looking at a green computer monitor.

State the stimulus and the receptor involved in this investigation.

[2]

Stimulus:...................
Receptor:..................

(ii) Describe how the information travels from the receptor to the central nervous system.

[2]

2b6 marks

The results for the students are shown in Table 8.2 and the teachers in Table 8.3.

Table 8.2

Name

Age

Reaction time (ms)

Rhidian

15

382

Iestyn

15

412

Reuben

15

375

James

15

399

Harvey

15

401

Mean reaction time = 394

Table 8.3

Name

Age

Reaction time (ms)

Miss Williams

42

479

Mr Davies

32

391

Mrs Wilcox

37

415

Mr Jones

55

475

Mrs Evans

48

431

Mean reaction time =.....

(i) Complete Table 8.3 by calculating the mean reaction time for the teachers to the nearest whole number.

[2]

(ii) Evaluate the extent to which the results in Tables 8.2 and 8.3 support the students’ hypothesis.

[2]

You should do this by giving:

  • one piece of evidence that supports the hypothesis

  • one piece of evidence that does not support the hypothesis Evidence that supports hypothesis

Evidence that supports hypothesis..................................

Evidence that does not support the hypothesis.................................

(iii) State one variable that should have been controlled in this investigation.

[1]

(iv) State one way that the students could have increased their confidence in their results.

[1]

3a1 mark

Researchers have created an artificial eye that models the constriction and dilation of the pupil. The change in size of the pupil in response to changing light levels is an example of a reflex arc.

Image 3.1A shows a diagram of the eye and Image 3.1B shows parts from the artificial eye model.

Cross-section diagram of an eye showing lens, iris, choroid, and retina next to an artificial light receptor setup with amplifier and muscle fibre.

Draw an arrow labelled A on Image 3.1A to show the sclera.

3b1 mark

State two properties of a reflex arc.

  1. .......................

  2. .......................

3c1 mark

State the name of the part of the eye represented by the artificial muscle fibre in Image 3.1B

3d2 marks

Describe how the diameter of the pupil changes in response to bright light. State the advantage of this change to the eye.

4a2 marks

In 2010, scientists in China carried out an investigation to compare the growth of seeds on Earth and on the moon.

They sent seeds in a sealed container on board a rocket to the moon. The sealed container contained all the necessary conditions to allow the seeds to grow. The sealed container had a small window at the top, which allowed sunlight to reach the growing seeds. The container was at the same atmospheric pressure as the Earth.

An identical sealed container which contained identical seeds was kept on Earth. The scientists observed the seeds growing in both containers.

Images 5.1A and 5.1B show the results of the investigations.

Diagram comparing a seed grown on the moon (left) with a seed grown on Earth (right), showing differences in root and shoot development.

State the name of:

(i) the growth response shown by the shoots in Image 5.1A and Image 5.1B.

[1]

(ii) the hormone that controls growth responses in plants.

[1]

4b2 marks

(i) Describe one difference in the growth of the roots in Images 5.1A and 5.1B.

[1]

(ii) Suggest one reason for the difference between the growth of seeds grown on the moon and those grown on Earth.

[1]

4c2 marks

State the term used for carrying out an identical investigation on Earth.
Suggest why this is important.

5a4 marks

Use some of the words from the box to complete the sentences about the nervous system.

cornea light chemical retina electrical receptor

Sense organs contain groups of ……………......................………… cells which respond to stimuli. In the eye, cells in the ……………......................………… respond to the stimulus of …………….........................… and send ……………......................………… impulses to the brain along neurones

5b1 mark

The diagram shows how the eye closes automatically (blinks) when something which may be harmful approaches.

Diagram of a bee approaching an eye, causing it to close. Arrows indicate the movement and the reaction of the eye to the bee.

Select the scientific term (A, B or C) for this type of action from the list below

A a release action
B a relax action
C a reflex action

5c2 marks

Apart from happening automatically, state two other properties of actions such as blinking.

1..........................
2.........................

6a2 marks

Image 2.1 shows a parsley plant (Petroselinum sp.) growing on a windowsill.

Image 2.1

Potted plant in a light blue pot sits on a speckled surface. Arrows labelled A, B, C, D point to the top, right, bottom, and left of the image, respectively.

The plant is showing a response to light called positive phototropism.

(i) State which one of arrows A, B, C or D on Image 2.1 shows the main direction of light.

[1]

Answer ......................................

(ii) Underline the name of the plant hormone involved in the response.

[1]

insulin amylase auxin

6b4 marks

Images 2.2 and 2.3 show an investigation into the effect of gravity on the growth of a seedling which has been placed horizontally on a laboratory bench.

(i) Complete Image 2.3 by drawing the root as you would expect to see it at day 4.

[2]

Diagram showing plant growth experiment over four days. Day 1: shoot and root horizontal. Day 4: shoot grows upwards, root downwards, using a cork block.

(ii) I. State the name of the response of the root to gravity.

[1]

II. Explain why this response is important to the seedling.

[1]

7a2 marks

Image 7.1 shows a section through the skin.

Complete labels A and B on Image 7.1.

Image 7.1.

Cross-section diagram of human skin showing layers including hair follicle, erector muscle, blood vessels, and structures labelled A and B, indicating glands.

Table 7.2 shows some features of the skin at two air temperatures.

Table 7.2

Air temperature

8°C

28°C

Volume of sweat produced per day (cm3)

800

1600

Diameter of blood vessel (mm)

0.005

0.1

Erector muscle

contracted

relaxed

7b6 marks

Using the information in Table 7.2, describe the changes in the skin which occur as the air temperature increases. Explain how each of these changes helps to cool the body

84 marks

Image 3 shows how the optimum body temperature is maintained.

Image 3

Diagram illustrating body temperature regulation with arrows showing heat gain and loss between increased and decreased body temperature states.

(i) State the name of the mechanism which maintains optimum body temperature.

[1]

(ii) State why it is important that human body temperature remains between 36.5°C and 37.5°C.

[1]

(iii) Apart from sweating, describe and explain one way the skin would have responded at point A on Image 3 to return the body temperature to its optimum.

[2]

9a2 marks

In a school experiment, germinating seeds were pinned to a cork plate (which was not rotating) and left in the dark for 48 hours.

The result of the experiment is shown in Image 4.1.

Image 4.1

Diagram showing a germinating seed with roots growing on a cork plate attached to a device. The plate is labelled as 'not rotating'.

State the name of the:

(i) growth response shown by the germinating roots in Image 4.1;

[1]

(ii) hormone which controls growth responses in plants.

[1]

9b2 marks

A second experiment was set up where germinating seeds were pinned to a cork plate which rotated three times per hour. The apparatus was left in the dark for 48 hours.

The result of the experiment is shown in Image 4.2.

Image 4.2

Diagram of a seed germinating on a rotating cork plate, showing root growth direction influenced by rotation, labelled with arrows and annotations.

Explain the growth of the roots in the result shown in Image 4.2.

9c1 mark

Suggest why the apparatus was kept in the dark for 48 hours.

10a2 marks

Complete the sentence by selecting your answers from the words below.

brain muscles spinal cord nerves

The central nervous system consists of the ........................................................... and the ..................................................... .

10b8 marks

Image 3.1 shows a section through the human eye.

Image 3.1

Cross-section diagram of the human eye showing labelled parts: sclera, retina, choroid, optic nerve, lens, and points A, B, C, and D.

(i) Label parts A and B on Image 3.1.

[2]

(ii) Using some labels from Image 3.1, complete Table 3.2 by stating the parts of the eye which match the functions.

[3]

Table 3.2

Part of the eye

Function

..............................................

changes shape to focus light

.............................................

prevents reflection of light

..............................................

carries nerve impulses to the brain

(iii) Joanna leaves a dark room and goes out into bright sunlight.

Person with curly hair wearing a grey top and denim overalls, smiling and shading their eyes from the sun with one hand, against a striped wall.

Explain how parts C and D in Image 3.1 change in order to control how much light enters her eyes when she goes into bright sunlight.

[3]

11a3 marks

Complete the following description of Type 2 diabetes by filling in the missing words.

In Type 2 diabetes, body cells do not respond to the hormone ....................................... which is produced by the ................................................. and so the level of ............................................. in the blood becomes too high.

11b8 marks

Researchers in Spain stated the following hypothesis.

‘Drinking coffee reduces the risk of having Type 2 diabetes, high blood pressure and obesity.’

  • Scientists working for a large chain of coffee shops carried out an investigation to test this hypothesis.

  • They used 2000 volunteers, 1000 of whom drank coffee every day and the other 1000 who never drank coffee.

  • They recorded the number of volunteers from each group who had Type 2 diabetes, had high blood pressure or were obese.

The results of the investigation are shown in Table 5.1.

Table 5.1

Condition

Number of volunteers with the condition

Coffee drinkers

Non-coffee drinkers

Type 2 diabetes

100

100

High blood pressure

280

420

Obesity

340

460

(i) Complete the bar chart in Graph 5.2 by:

[4]

I. adding a scale for numbers of volunteers.
II. drawing bars of the results for high blood pressure and obesity.
III. labelling your bars.

Graph 5.2

Bar chart showing the number of volunteers with Type 2 diabetes. Key differentiates coffee drinkers (shaded) and non-coffee drinkers (unshaded).

(ii) The scientists concluded that the hypothesis was only partly supported. Give the reasons for this conclusion.

[2]

(iii) State one way in which the scientists should have ensured that the investigation was a fair test.

[1]

(iv) A doctor said that she did not have confidence in the results because the investigation was biased.

Give one reason to support this point of view.

[1]

11c1 mark

In 2019 the cost to NHS Wales of medical treatments for Type 2 diabetes was £500 million.

Suggest one lifestyle change which individuals can make to reduce the risk of developing Type 2 diabetes.

12a7 marks

Image 4.1 shows a reflex arc.

Diagram of a reflex arc showing components: stimulus at the foot, spinal cord (A, B, C, D), nerve pathway, and effector muscle response.

(i) Label A–D on Image 4.1.

[4]

(ii) State two properties of reflex actions.

[1]

(iii) The length of neurone B is 0.9m. An electrical impulse can travel along a neurone at 75m/s.

Use the following equation:

Speed equals distance over time

to calculate the time taken for the impulse to travel the length of neurone B.

[2]

Time = ...............................................s

12b2 marks

Motor neurone disease prevents motor neurones functioning effectively. Explain why individuals with the disease find it difficult to walk.

13a2 marks

Image 9.1 shows a section through human skin.

Image 9.1

Diagram of a hair follicle in skin cross-section, showing layers, a sebaceous gland, nerve endings, and an arrector pili muscle with connective tissue.

On Image 9.1, draw labelled arrows to name and identify:

(i) the structure where sweat is produced;

[1]

(ii) a structure which transports blood.

[1]

13b5 marks

Gareth carried out an experiment to investigate homeostasis. He sat in a room heated to 50°C. His internal body temperature, rate of sweating and skin temperature were monitored. After 10 minutes in the room, he drank a glass of ice-cold water. The results are shown in Graph 9.2.

Graph 9.2

Graph showing internal body temperature, skin temperature, and sweating rate over 50 minutes after drinking ice-cold water at 10 minutes.

Explain the effect that drinking the ice-cold water had on Gareth between 10 minutes and 30 minutes, as shown on Graph 9.2.