Practical Skills (AS & A Level) (AQA A Level Biology): Exam Questions

Exam code: 7402

3 hours14 questions
1a3 marks

An experiment was conducted to investigate amylase activity. The contents from a section of gut from a mouse were obtained and then added to a starch solution (which was at pH 6.9 and kept in a 30°C water bath). Every three minutes samples were removed and added to separate test tubes containing a diluted iodine solution. The colour intensity for each sample was determined. Figure 1 below shows the results.

 Figure 1

Y9YVP_l8_1


Describe and explain the results seen in Figure 1.

1b2 marks

Sketch two labelled curves on Figure 1 to show the predicted results of the experiment if it was carried out at:

i) pH 1.8

ii) 45 °C

1c4 marks

Explain how lowering the pH affects the activity of the enzyme amylase.

1d3 marks

Explain how increasing the temperature to 40 °C affects the activity of the enzyme amylase.

2a3 marks

A biology student wanted to investigate the stages of mitosis in onion root tips. To do this they prepared a stained squashed sample of onion root tip cells. They used the following method:

  • Cut first 4-6 mm from onion root tip and place on glass slide (shown in Figure 1)

  • Add stain solution to the tip and lay cover slip over tip

  • Press down firmly on cover slip

 Figure 1

fr2tNQSu_2

Explain why the student:

i) only used the first 4-6 mm of onion root tip.

ii) added stain solution to the onion root tip.

iii) pressed down firmly on the cover slip.

2b2 marks

The biology student looked at their stained squash of onion root tip cells under the microscope and obtained the data shown in Table 1.

 Table 1

Stage of mitosis

Number of cells observed

Interphase

521

Prophase

63

Metaphase

19

Anaphase

12

Telophase

4

Calculate the percentage of cells in which the chromosomes are visible and are lined up along the middle of the cell. Show your working.

2c2 marks

The biology student wanted to repeat the procedure in parts (a) and (b) with more onion root tips (from genetically identical onion plants) to check the accuracy of their results in part (b).

Suggest two variables that the student should control to ensure similar root growth in the other onion plants. For each variable, explain why it should be controlled.

2d2 marks

The student in parts (a), (b) and (c) conducted further studies on different sections of onion roots. They found that the proportion of dividing cells decreased with increasing distance from the root tip.

Explain why they found this result.

3a2 marks

A biologist was investigating the effect of three types of antibiotic on the growth of Streptococcus bacteria. The student biologist carried out the following procedure:

  • Boil the agar before pouring the agar plates

  • Flood agar plates with a liquid culture of Streptococcus

  • Place four sterile paper discs, A, B, C and D onto the agar plates (three soaked in different antibiotics, one in sterile water)

  • Incubate agar plates at 37 °C for three days

Explain why the biologist:

i) Boiled the agar.

ii) Soaked one of the paper discs in sterile water.

3b4 marks

The biologist in part (a) should use aseptic techniques to transfer the liquid culture of Streptococcus onto the agar plate.

Describe two aseptic techniques that the biologist should use and for each, explain why these techniques are important.

3c2 marks

Certain factors can affect the rate at which the antibiotics from each paper disc diffuse through the agar.

State two of these factors and for each one, describe the effect it would have on the rate of diffusion through the agar.

3d1 mark

Name the process by which bacterial cells divide.

4a2 marks

A biologist carried out an investigation to find the water potential of carrot tissue. The biologist started with a carrot and 100 cm3 of a 1.0 mol dm−3 sucrose solution. They made a series of different concentrations of sucrose solution using the 1.0 mol dm−3 solution. They cut and weighed cylinders of carrot tissue and left them in the sucrose solutions for a set time. They then removed the carrot cylinders and blotted them dry before reweighing them.

Explain why the biologist blotted the carrot cylinders dry before reweighing them.

4b2 marks

Suggest how the biologist in part (a) could use a 1.0 mol dm−3 solution of sucrose to produce 60 cm3 of a 0.30 mol dm−3 solution of sucrose. Use calculations as part of your answer.

4c2 marks

The biologist presented the results of their investigation from part (a) in Table 1 below:

 Table 1 

Concentration of sucrose solution / mol dm−3

Percentage change in mass of carrot cylinder

0.30

+3.6

0.40

+2.9

0.50

+1.1

0.60

-0.6

0.70

-2.4

 Describe how the biologist could use their results in Table 1 to find the water potential of the carrot tissue.

4d2 marks

The biologist in part (a) calculated the percentage change in mass rather than just the change in mass. Explain why it might have been advantageous to do this.

5a5 marks

Betalains are pigments found in the cell vacuole of beetroot cells and are responsible for the dark purple-red colour of beetroot tissue. A student wanted to investigate how alcohol concentration affected the loss of these pigments from beetroot tissue. They obtained the results shown in Table 1 below:

 Table 1

Alcohol concentration / %

Absorbance / AU

0

0.36

20

0.48

40

0.72

60

0.95

80

1.08

100

1.22

Suggest a suitable method that the student could use to obtain these results.

5b2 marks

Determine a conclusion from the results shown in Table 1.

5c2 marks

Another student wanted to investigate the effect of temperature on the loss of pigment from beetroot. They put beetroot discs into test tubes containing water and placed the tubes in water baths at a different temperature. After 40 minutes, they measured the percentage of light passing through the water in each tube.

Explain why it was important that the student made sure each test tube contained the same volume of water to begin with.

5d2 marks

The student in part (c) found that the higher the temperature, the more pigment was released from the beetroot and the lower the percentage of light passing through the water in each tube.

Suggest how an increase in the temperature of the water caused pigment to be released from the beetroot.

6a2 marks

Insects have a system of very small air-filled pipes called tracheae which they use for gas exchange. A student wants to dissect a grasshopper to view the tracheae.

Give two safety precautions the student should take when carrying out this dissection.

6b1 mark

Describe one ethical issue involved in the dissection of animals for scientific purposes.

6c3 marks

The tracheal system of the grasshopper that the student dissected in part (a) is adapted for efficient gas exchange. Explain how.

6d2 marks

Insect spiracles have valves that enable them to be closed by the insect. In many insect species, the spiracles are also surrounded by tiny hairs. Suggest the advantage of each of these features for an insect in hot weather.

7a
Sme Calculator
3 marks

A student investigated the effect of temperature on the rate of aerobic respiration in yeast. They used a respirometer to measure the volume of carbon dioxide produced over a 10-minute period. The experiment was repeated three times at each temperature, after which the student calculated the mean volume of CO2 and the mean pH of each suspension. The results are shown in Table 1.

Table 1

Temperature / °C

Mean volume of CO2 / cm³ (± SD)

Mean pH of suspension

20

8.4 ± 0.5

5.3

30

20.1 ± 0.7

4.9

40

12.6 ± 1.9

4.6

50

2.1 ± 2.4

4.3

(i) Calculate the difference in the mean rate of CO2 production per minute at 30 °C and 50 °C.

[2]

ii) The standard deviation is higher in the data recorded at 50 °C compared to 30 °C.

State what this means about the data set recorded at 50 °C in comparison to the data at 30 °C.

[1]

7b4 marks

A student concluded that the optimum temperature for aerobic respiration in yeast is 30 °C.

Evaluate this conclusion using data from Table 1 and your own knowledge.

7c2 marks

Suggest why changes in pH are observed during the students' investigation.

7d3 marks

Explain why the changes in pH may have affected the results.

7e2 marks

The students repeated the investigation three times, each time using the same volume of yeast suspension.

Explain why this was important.

7f1 mark

A student suggested that they should use a t-test to analyse the relationship between temperature and the rate of respiration.

Explain why this may not be appropriate.

8a3 marks

A student investigated the concentration of glucose in urine samples using a colorimeter and Benedict’s reagent.

They first prepared dilutions from a 4.0 M stock solution to produce several glucose samples at each known concentration. They added Benedict’s reagent to each, heated the tubes in a water bath, and then centrifuged the samples. They used a colorimeter to measure the absorbance of the supernatant.

The student then repeated the procedure using a urine sample from a person suspected of having diabetes.

The results are shown in Table 1.

Table 1

Glucose concentration / M

Mean absorbance / arbitrary units (± SD)

0.00

1.00 ± 0.02

1.00

0.81 ± 0.03

2.00

0.59 ± 0.04

3.00

0.38 ± 0.02

4.00

0.19 ± 0.01

Unknown sample

0.42

Outline the method that could be used by the students to prepare 20 cm3 of glucose solution in the concentrations shown in Table 1.

8b3 marks

Draw a calibration curve using the data for the known glucose concentrations. Include error bars.

A grid paper sheet with evenly spaced light grey squares, used for drawing or plotting data, fills the image with no additional elements.
8c
Sme Calculator
1 mark

Use your graph to estimate the glucose concentration of the unknown urine sample.

8d3 marks

In this investigation the student used a colorimeter to measure the absorbance of solutions after performing a Benedict’s test.

State the advantages of using a colorimeter in comparison to making visual observations of colour changes.

8e3 marks

The student concluded that the person who produced the urine sample has diabetes.

Evaluate this conclusion.

9a3 marks

A student investigated the effect of light intensity on the rate of dehydrogenase activity in chloroplast extracts using DCPIP as an electron acceptor.

They altered light intensity by placing a lamp at varying distances from test tubes containing the reaction mixture. Each tube contained chloroplast extract, DCPIP solution, and a buffer solution. The student measured the time taken for the blue DCPIP to become colourless at each light intensity. They repeated the experiment at each light intensity and calculated a mean value.

The results are shown in Table 1.

Table 1

Distance from lamp / cm

Light intensity / arbitrary units

Mean time taken to become colourless / s (±SD)

Rate of dehydrogenase activity / s-1

10

100

45 ± 3

20

25

120 ± 5

30

11

180 ± 8

40

6

300 ± 12

50

4

450 ± 15

Outline how the student should prepare the reaction mixture for each test tube to ensure valid results.

9b
Sme Calculator
5 marks

(i) Calculate the rate of dehydrogenase activity for each light intensity in Table 1.

[1]

(ii) Draw a graph to show the relationship between light intensity and rate of dehydrogenase activity. Include error bars.

A grid paper sheet with evenly spaced light grey squares, used for drawing or plotting data, fills the image with no additional elements.

[3]

9c1 mark

Use your graph to estimate the rate of dehydrogenase activity at a light intensity of 15 arbitrary units.

9d1 mark

In this investigation, the student used DCPIP as an electron acceptor to measure dehydrogenase activity in chloroplasts.

Suggest why it might be considered preferable to use DCPIP in this investigation instead of measuring oxygen production to assess the rate of the light-dependent reaction.

9e3 marks

The student concluded that light intensity is the limiting factor for the rate of dehydrogenase activity in chloroplasts.

Evaluate this conclusion.

10a
Sme Calculator
5 marks

Pepsin is a protease enzyme found in the stomach. Scientists investigated the effect of temperature on pepsin activity. They measured the rate of protein breakdown at five different temperatures in a buffered solution at pH 2.

Each measurement was repeated with three samples. The results are shown in Table 1.

Table 1

Temperature (°C)

Mean rate of protein breakdown (μg min⁻¹) ± SD

10

0.15 ± 0.02

20

0.28 ± 0.03

30

0.46 ± 0.04

40

0.49 ± 0.05

60

0.10 ± 0.01

(i) Plot a graph that represents these data.

[3]

A grid paper sheet with evenly spaced light grey squares, used for drawing or plotting data, fills the image with no additional elements.

(ii) Explain the effect of temperature on pepsin activity between 10 °C and 40 °C.

[2]

10b
Sme Calculator
1 mark

The Q₁₀ value shows how much the rate of a reaction changes when the temperature increases by 10 °C.

The formula for calculating Q₁₀ is:

straight Q subscript 10 space equals fraction numerator Rate space at space higher space temperature space ​ over denominator Rate space at space lower space temperature space ​ end fraction

Use this formula and the data in Table 1 to calculate the Q₁₀ value for pepsin activity between 20 °C and 30 °C.

Give your answer to two significant figures.

10c2 marks

Explain why pepsin activity is low at 60 °C.

10d3 marks

(i) Evaluate the reliability of this experiment

[2]

(ii) Suggest one way the reliability could be improved.

[1]

10e4 marks

The scientists concluded that 30 °C is the optimum temperature for pepsin activity.

Assess this conclusion using the data provided in Table 1.

11a
Sme Calculator
5 marks

Students investigated the pigments in leaves from two types of plants:

  • Species A: a shade-tolerant plant

  • Species B: a shade-intolerant plant

They extracted pigments from each leaf using propanone, spotted the extracts onto chromatography paper, and ran the chromatography using a suitable solvent. After drying, they measured the distance each pigment had travelled.

The chromatography results are summarised in Table 1.

Table 1

Pigment

Distance moved in Species A (mm)

Distance moved in Species B (mm)

Solvent front (mm)

Chlorophyll a

65

65

90

Chlorophyll b

56

35

90

Xanthophyll

40

75

90

Carotene

45

85

90

(i) Describe one way in which students ensured their method was controlled when applying the pigment extracts to the chromatography paper.

[1]

The Rf value (retention factor) is used in chromatography to compare how far a substance travels relative to the solvent front. The closer the Rf is to 1, the further the pigment travelled

R f space equals space fraction numerator D i s tan c e space m o v e d space b y space p i g m e n t over denominator D i s tan c e space m o v e d space m y space s o l v e n t end fraction

(ii) Calculate the mean Rf value for chlorophyll b.

Give your answer to 2 decimal places.

[2]

(iii) State two variables that must be controlled to ensure valid comparisons of pigment migration between the two species.

[2]

11b2 marks

The chromatogram for Species A contained more chlorophyll b relative to chlorophyll a compared to Species B.

Suggest how this difference may help Species A survive in a shaded environment.

11c3 marks

Describe how students could extract the pigments from the leaves using safe and effective practical techniques.

11d4 marks

The students concluded that chlorophyll b is more important for photosynthesis inshade-tolerant plants.

Evaluate this conclusion using the chromatography data and your knowledge of photosynthesis.

12a
Sme Calculator
3 marks

Students investigated the effect of light intensity on the movement of woodlice using a choice chamber. They set up the apparatus with different light conditions and recorded the distribution of woodlice over time.

The students collected the following data after 10 minutes:

Table 1

Light condition

Number of woodlice in section A

Number of woodlice in section B

Total number of woodlice

Bright light vs Dark

3

17

20

Dim light vs Dark

8

12

20

Bright light vs Dim light

5

15

20

(i) Describe one way in which students ensured their method was controlled when setting up the choice chamber.

[1]

The preference index is used to quantify animal behaviour in choice chambers. It is calculated as:

\text{Preference index} = \frac{\text{Number in preferred section} - \text{Number in non-preferred section}}{\text{Total number of animals}}

A positive value indicates preference for the test condition, while a negative value indicates avoidance.

(ii) Calculate the mean preference index for dark conditions across all experiments.

Give your answer to 2 decimal places.

[2]

12b2 marks

The results showed that woodlice consistently moved away from bright light conditions towards darker areas.

Suggest how this behaviour may help woodlice survive in their natural habitat.

12c3 marks

Describe how students could set up a choice chamber to investigate the effect of humidity on woodlice movement .

12d4 marks

The students concluded that woodlice show a strong preference for dark, humid conditions based on their choice chamber results.

Evaluate this conclusion using the experimental data and your knowledge of animal behaviour.

13a
Sme Calculator
5 marks

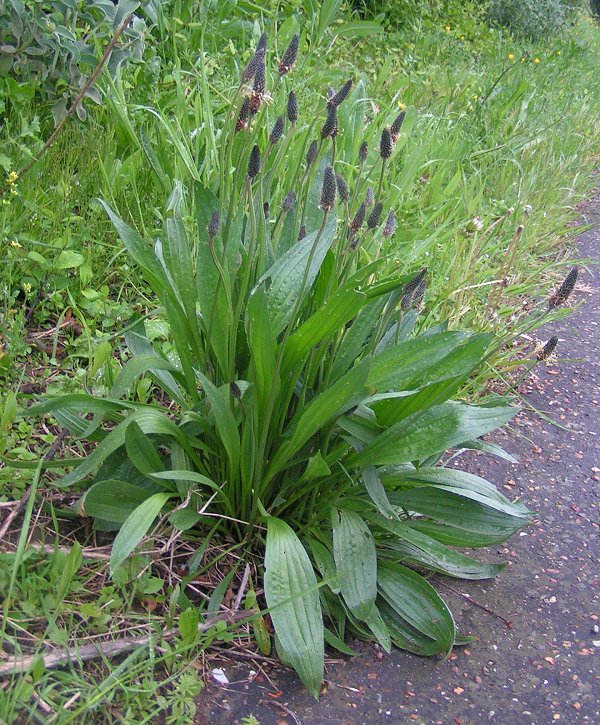
Students compared the abundance of ribwort plantain (Plantago lanceolata) in two areas of school field; area A and area B. They used 0.5 m × 0.5 m quadrats.

Plantain plant with long green leaves and tall seed heads, growing beside a path on a grassy verge.
By sannse - Originally uploaded to English Wikipedia as Ribwort 600.jpg, CC BY-SA 3.0, https://commons.wikimedia.org/w/index.php?curid=2149536

They placed 15 quadrats in each field and counted the number of individual ribwort plantain plants present in each quadrat.

The results are shown in Table 1.

Table 1

Quadrat

Area A

Area B

1

3

5

2

0

4

3

5

3

4

2

6

5

4

4

6

1

5

7

0

7

8

2

6

9

6

3

10

0

4

11

3

4

12

1

2

13

0

4

14

4

4

15

0

3

(i) Describe how students should have ensured that their sampling method was unbiased.

[2]

(ii) Field A measured 30 m x 20 m.

Calculate the estimated number of ribwort plantain individuals present in field A.

[2]

(iii) Identify one factor, other than bias, that might cause the answer in (ii) to be an inaccurate estimate for field A.

[1]

13b3 marks

The students decided to count the number of plantain individuals present in each quadrat.

(i) Describe an alternative method that could be used to assess plantain abundance.

[2]

(i) State why the method in (i) might be chosen over counting individuals in some investigations.

[1]

13c2 marks

The students concluded that ribwort plantain is patchily distributed across field A.

Use the data in Table 1 to evaluate this conclusion.

13d2 marks

One of the students wanted to determine whether the abundance of plantain differed significantly between field A and field B, or whether the differences were due to chance alone.

(i) State how the student could determine this.

[1]

(ii) Explain your choice of method for (i).

[1]

13e4 marks

Describe how students could investigate the distribution of ribwort plantain in relation to abiotic conditions in the field.

14a4 marks

Students investigated the effect of light intensity on the rate of transpiration in privet (Ligustrum vulgare) using a potometer. They set up a potometer in full sunlight and another in a room with the windows covered.

They measured the distance moved by the air bubble in the capillary tube over 10-minutes for each location.

The results are shown in Table 1.

Table 1

Time interval

Distance moved by air bubble / mm

Room in full sunlight

Darkened room

1

2.5

0.8

2

2.8

1.1

3

2.4

0.9

4

2.4

1.2

5

2.7

1.1

6

2.9

1.0

7

2.4

1.3

8

2.6

1.1

9

2.5

1.3

10

2.7

0.9

(i) Describe how the potometer and plant shoot should be set up to ensure that it measures water uptake accurately.

[2]

(ii) The student ensured that the humidity levels were the same in each of the two rooms.

Identify two other variables that should have been controlled during the investigation.

[2]

14b
Sme Calculator
4 marks

(i) The capillary tube of the potometer had an internal diameter of 3 mm.

Use the formula provided below to calculate the volume of water taken up over 10 minutes for the potometer in full sunlight.

volume = π r2 h

[2]

(ii) Describe the effect of light intensity on the rate of transpiration. Use the data in Table 1 to support your answer.

[2]

14c2 marks

Explain why the experiment described in part (a) may not provide an accurate measurement of transpiration rate.

14d3 marks

The student repeated the experiment with two potometers, both in a room with direct sunlight. They placed a plastic bag over the privet shoot on one of the potometers, and found that the transpiration rate for this shoot decreased in comparison to the uncovered shoot.

Explain the student's observation.