The Benedict's Test (Cambridge (CIE) A Level Biology): Revision Note
Exam code: 9700

The Benedict's test for reducing sugars
Method
Add Benedict's reagent (which is blue as it contains copper (II) sulfate ions) to a sample solution in a test tube
It is important that an excess of Benedict’s solution is used so that there is more than enough copper (II) sulfate present to react with any sugar present
Heat the test tube in a water bath or beaker of water that has been brought to a boil for a few minutes
If a reducing sugar is present, a coloured precipitate will form as copper (II) sulfate is reduced to copper (I) oxide which is insoluble in water
A positive test result is, therefore, a colour change somewhere along a colour scale from blue (no reducing sugar) to brown/brick-red (a high concentration of reducing sugar)
This test is semi-quantitative as the degree of the colour change can give an indication of how much (the concentration of) reducing sugar present
Semi-quantitative Benedict's test
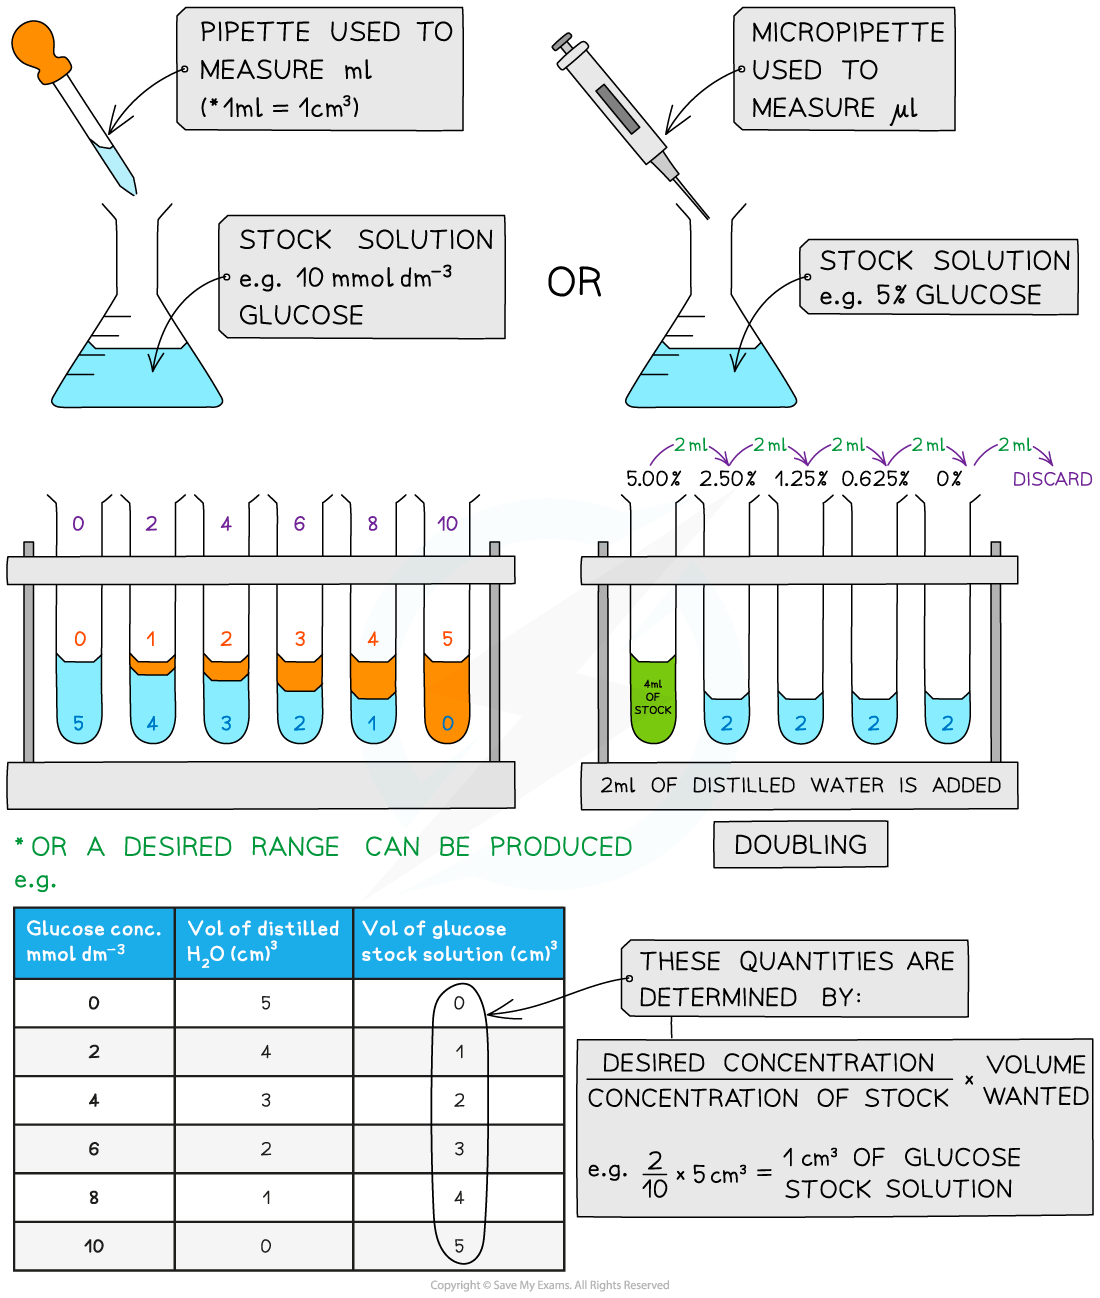
A semi-quantitative test can be carried out by setting up standard solutions with known concentrations of reducing sugar (such as glucose)
These solutions should be set up using a serial dilution of an existing stock solution
Each solution is then treated in the same way:
Add the same volume of Benedict’s solution to each sample
Heat in a water bath that has been boiled (ideally at the same temperature each time) for a set time (5 minutes or so) to allow colour changes to occur
It is important to ensure that an excess of Benedict’s solution is used
Any colour change observed for each solution of a known concentration in that time can be attributed to the concentration of reducing sugar present in that solution
The same procedure is carried out on a sample with an unknown concentration of reducing sugar which is then compared to the stock solution colours to estimate the concentration of reducing sugar present
Alterations
It is also possible to standardise this test but instead of waiting a fixed amount of time for a range of colours to be observed, time how long it takes for the first colour change to occur (blue to green)
The higher the concentration of reducing sugar in a sample, the less time it would take for a colour change to be observed
To avoid issues with human interpretation of colour, a colourimeter could be used to measure the absorbance or transmission of light through the sugar solutions of known concentration to establish a range of values that an unknown sample can be compared against a calibration curve
Serial dilutions
Serial dilutions are created by taking a series of dilutions of a stock solution. The concentration decreases by the same quantity between each test tube
They can either be ‘doubling dilutions’ (where the concentration is halved between each test tube) or a desired range (e.g. 0, 2, 4, 6, 8, 10 mmol dm-3)
Serial dilutions are completed to create a standard to compare unknown concentrations against
The comparison can be:
Visual
Measured through a calibration/standard curve
Measured using a colourimeter
They can be used when:
Counting bacteria or yeast populations
Determining unknown glucose, starch, protein concentrations
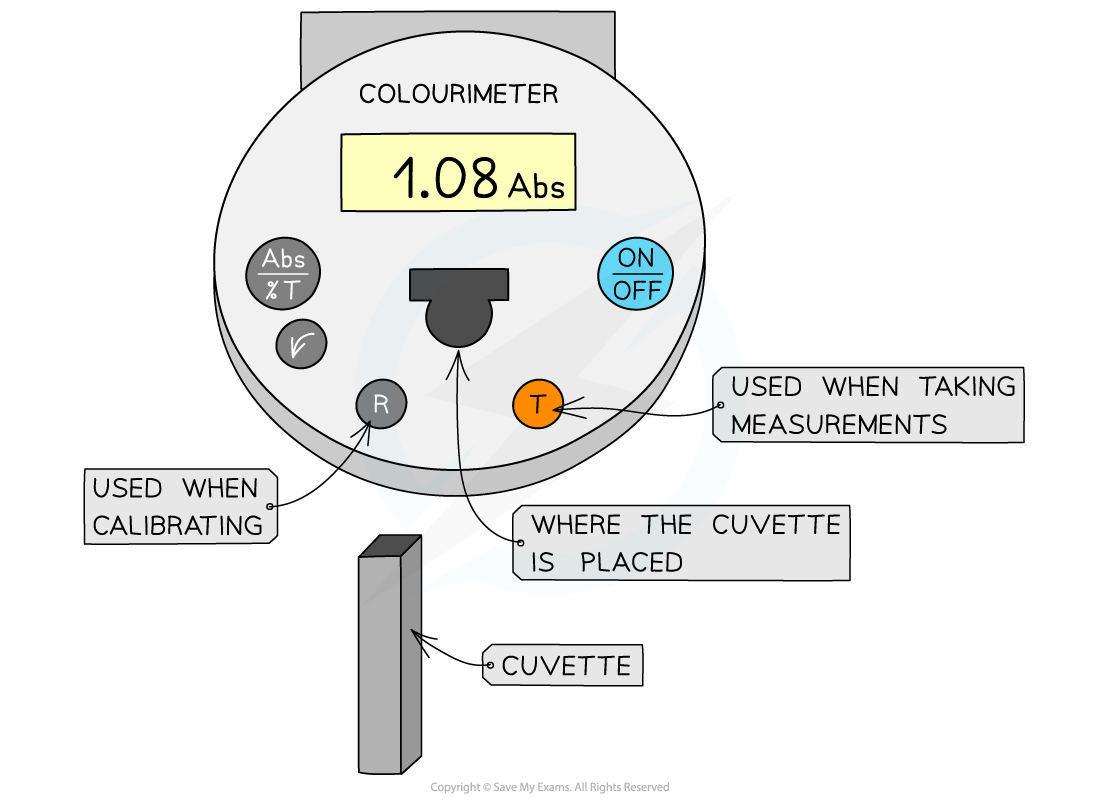
Using a colorimeter
A colorimeter is an instrument that beams a specific wavelength (colour) of light through a sample and measures how much of this light is absorbed by the sample
Colour filters are used to control the light wavelength emitted
The colour used will be in contrast to the colour of the solution, e.g. Benedict's solution turns orange in the presence of sugar, so the colorimeter will assess the intensity of the orange colour
In order to do this a blue light filter would be used to shine blue light through the sample
Blue light is absorbed by an orange solution as orange light is reflected to give the orange appearance
The extent to which the blue light is absorbed will differ depending on the intensity of the orange colour; a solution that is orange/green will absorb less blue light than a solution that is brick red
The absorbance value therefore provides a quantitative measure of the strength of the orange colour
Colorimeters must be calibrated before taking measurements
This is completed by placing a blank into the colorimeter and taking a reference; it should read 0 (that is, no light is being absorbed)
This step should be repeated periodically whilst taking measurements to ensure that the absorbance is still 0
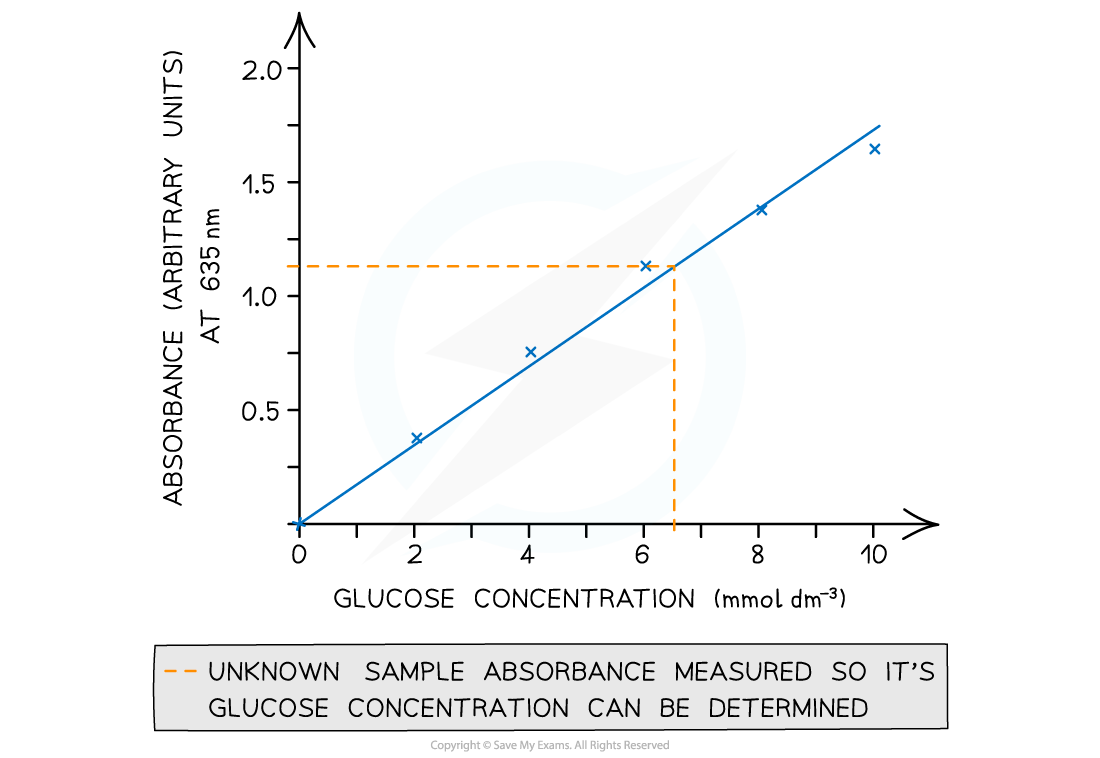
The results can then be used to plot a calibration or standard curve
Absorbance against the known concentrations can be used
Unknown concentrations can then be determined from this graph
Examiner Tips and Tricks
For fair comparison in semi-quantitative tests, make sure volume of sample, volume of Benedict’s, temperature, and heating time are the same for every tube — exam questions may award marks for recognising these as control variables.

Unlock more, it's free!
Join the 100,000+ Students that ❤️ Save My Exams
the (exam) results speak for themselves:

Was this revision note helpful?
