Practical Techniques & Data Analysis (AQA A Level Chemistry): Exam Questions

Exam code: 7405

3 hours21 questions
1a2 marks

A student prepared a standard solution of sodium carbonate and used it to determine the concentration of a sample of hydrochloric acid by titration.

The student dissolved 2.78 g of anhydrous sodium carbonate (Na2CO3) in deionised water and made the solution up to 250.0 cm3 in a volumetric flask.

Calculate the concentration, in mol dm-3, of this standard sodium carbonate solution. The Mr of Na2CO3 is 106.0.

1b2 marks

Describe the method, using correct terminology, for how the student should have ensured the volumetric flask was filled precisely to the 250.0 cm3 mark.

1c1 mark

The student then used this standard solution to titrate 25.0 cm3 samples of hydrochloric acid. The results are shown in Table 1.

Table 1

Titration

Rough

1

2

3

4

Final burette reading / cm3

23.80

23.15

46.35

23.85

46.95

Initial burette reading / cm3

0.30

0.00

23.15

0.65

23.85

Titre / cm3

23.50

23.15

23.20

23.20

23.10

Explain why Titres 1, 2, 3 and 4 are considered concordant and should be used to calculate the mean titre.

1d1 mark

Use the appropriate results from Table 1 to calculate the mean titre.

1e3 marks

The equation for the reaction is:

Na2CO3 (aq) + 2HCl (aq) → 2NaCl (aq) + H2O (l) + CO2 (g)

Use your answers from part (a) and part (d) to calculate the concentration of the hydrochloric acid. Give your answer to 3 significant figures.

1f1 mark

The student noticed that effervescence occurred in the conical flask during the titration.

Suggest why using a conical flask is good practice in a titration where a gas is produced.

2a1 mark

A student is given an unknown organic liquid, A, which is known to be one of the four compounds shown below.

butan-1-ol

butanal

butanone

butanoic acid

The student carries out a series of tests on sample A. The results are shown in the flow chart in Figure 1.

Figure 1

Flowchart of tests on Unknown Liquid A: Test 1 with A turns green; Test 2 with Tollens' reagent shows no change; Test 3 with sodium carbonate shows no change.

Use the results in Figure 1 to identify compound A.

2b2 marks

The reagent used in Test 1 is acidified potassium dichromate(VI).

Give the formula of the active chromium species in the reagent before and after a positive test.

2c2 marks

Describe the preparation of the Tollens' reagent used in Test 2.

3a4 marks

A student carried out an experiment to determine the enthalpy of combustion of ethanol (C2H5OH). They burned a known mass of ethanol in a spirit burner and used the heat released to raise the temperature of a known volume of water in a copper calorimeter.

The student's results and relevant data are shown below.

Measurement

Value

Initial mass of spirit burner

185.73 g

Final mass of spirit burner

185.25 g

Volume of water in calorimeter

150.0 cm3

Initial temperature of water

22.5 oC

Final temperature of water

39.0 oC

Data

  • Mr of ethanol = 46.0

  • Specific heat capacity of water, c = 4.18 J g-1 K-1

  • Density of water = 1.00 g cm-3

  • Accepted standard enthalpy of combustion of ethanol, ΔHc = –1367 kJ mol-1

Use the student's results to calculate an experimental value for the enthalpy of combustion of ethanol, in kJ mol⁻¹.

3b1 mark

Use your answer from part (a) and the accepted data book value to calculate the percentage error in the student's experimental result.

3c2 marks

The student's calculated value is significantly less exothermic than the accepted data book value.

Suggest two major sources of error in this experimental method that could account for this difference.

4a4 marks

A student carried out a series of experiments to determine the relative molecular mass, Mr, of a volatile organic liquid, Y.

In each experiment, a known mass of liquid Y was injected into a gas syringe which was heated to a constant temperature of 90 oC in an oven. The liquid vaporised, and the volume of the gas produced was recorded. The pressure in the laboratory was 101 kPa. The student's results are shown in Table 1.

Table 1

Mass of liquid Y / g

Volume of gas / cm³

0.18

75

0.25

103

0.33

138

0.40

166

0.49

205

Use the results from the first experiment only (mass = 0.18 g) and the ideal gas equation, pV = nRT, to calculate a value for the Mr of liquid Y.

The gas constant R = 8.31 J K-1 mol-1.

Show your working.

4b3 marks

On the grid provided, plot a graph of volume of gas against mass of liquid. Draw a line of best fit.

Graph paper with a grid of small squares outlined in light grey, suitable for technical drawings or mathematical plotting.
4c4 marks

Use your line of best fit from part (b) to determine a more accurate value for the Mr of liquid Y. Show your working.

4d1 mark

Explain why the value for the Mr calculated from the line of best fit is likely to be more accurate than the value calculated from the single experiment in part a.

4e2 marks

Suggest two potential sources of error in this experimental method, other than measurement errors.

5a1 mark

A student carried out an experiment to determine the enthalpy of solution (ΔHsol) for sodium chloride (NaCl).

The student dissolved 2.34 g of NaCl in 50.0 cm3 of deionised water in a polystyrene cup and recorded a temperature change of –0.7 oC.

State one key procedural step, other than insulating the cup, that the student should have taken to ensure the measured temperature change was as accurate as possible.

5b3 marks

Use the student's results to calculate the enthalpy of solution, ΔHsol, for sodium chloride.

Give your answer in kJ mol-1.

(Mr of NaCl = 58.5; specific heat capacity of water = 4.18 J g-1 K-1; assume the density of water is 1.00 g cm-3)

5c1 mark

The accepted data book value for the enthalpy of solution of NaCl is +3.9 kJ mol-1.

Suggest one reason for the difference between the student's experimental value and the accepted value.

5d2 marks

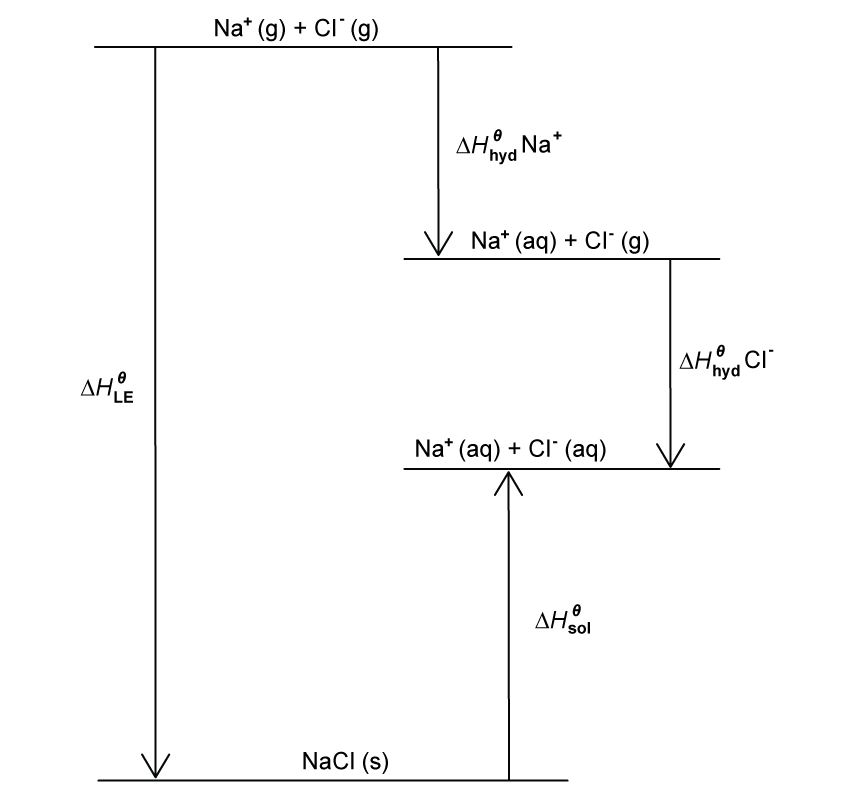
The enthalpy of solution can be related to lattice enthalpy and hydration enthalpies using the energy cycle shown in Figure 1.

Figure 1

An enthalpy diagram showing the hydration and lattice energies of Na+ and Cl- ions, starting from gaseous ions to solid NaCl and aqueous ions.

Use your experimental value for the enthalpy of solution from part (b) and the data below to calculate a value for the lattice enthalpy of dissociation for NaCl.

  • Enthalpy of hydration of Na+ (g) = –406 kJ mol-1

  • Enthalpy of hydration of Cl- (g) = –364 kJ mol-1

5e2 marks

Explain why the lattice enthalpy of dissociation for magnesium oxide is significantly more endothermic than that of sodium chloride.

6a2 marks

A student carried out a series of experiments to investigate the kinetics of the reaction between hydrogen peroxide and iodide ions in an acidic solution.

H2O2 (aq) + 2I- (aq) + 2H+ (aq) → I2 (aq) + 2H2O (l)

In each experiment, a small, fixed amount of sodium thiosulfate and starch indicator were added. The initial rate of reaction was determined by measuring the time, t, for the blue-black colour to appear. The initial rate is proportional to 1/t.

The student's results are shown in Table 1.

Table 1

Experiment

Initial [I-] / mol dm-3

Initial [H+] / mol dm-3

Time, t / s

Initial Rate ∝ 1/t / s-1

1

0.010

0.020

50

0.020

2

0.020

0.020

25

0.040

3

0.010

0.040

25

0.040

4

0.020

0.040

12.5

0.080

Explain the purpose of the sodium thiosulfate in this experiment.

6b2 marks

The student ensured that the concentration of hydrogen peroxide and the total volume of the solution were kept constant in each experiment.

Explain the steps the student would have taken to ensure the concentration of hydrogen peroxide was kept constant.

6c4 marks

Use the data in Table 1 to deduce the order of reaction with respect to I- (aq) and with respect to H+ (aq). Explain your reasoning.

6d1 mark

Give the rate equation for this reaction.

6e2 marks

Use the data from Experiment 4 to calculate a value for the rate constant, k.

Give the units for k.

7a2 marks

A chemist analyses a sample of petrol using gas chromatography (GC). The stationary phase is a non-polar liquid adsorbed onto a solid support, and the mobile phase is an inert gas.

The resulting chromatogram is shown in Figure 1. Each peak corresponds to a different hydrocarbon.

Figure 1

Graph showing four peaks labelled A to D on a retention time axis in minutes, with peaks representing relative abundance against retention time.

In gas chromatography, describe the stationary phase and the mobile phase.

7b3 marks

Use the chromatogram in Figure 1 to identify:

  • the most abundant hydrocarbon in the mixture.

  • the hydrocarbon with the highest boiling point.

Explain your reasoning for the hydrocarbon with the highest boiling point.

7c1 mark

Explain why gas chromatography is a suitable technique for analysing a mixture of hydrocarbons found in petrol.

7d2 marks

The gas chromatograph can be connected to a mass spectrometer (GC-MS).

State the two pieces of information that could be obtained about a compound by analysing a peak using a mass spectrometer.

8a3 marks

A student prepared a sample of aspirin. After filtering, the student obtained impure crystals of aspirin. The student purified the crude product by recrystallisation.

State three properties of a suitable solvent for the recrystallisation of aspirin.

8b5 marks

Outline the key steps of the recrystallisation process that the student should carry out to obtain a purified sample of dry aspirin crystals.

8c2 marks

State the apparatus used to filter the purified crystals from the solution and explain why this method of filtration is preferred over gravity filtration.

8d2 marks

The student then measured the melting point of both the impure and the purified samples of aspirin. The results are shown in Table 1.

Table 1

Sample

Melting Point Range / oC

Impure aspirin

127 – 132

Purified aspirin

135 – 136

Data book value for pure aspirin

136

Explain how the data in Table 1 indicate that the recrystallisation process was successful.

9a3 marks

A student investigated the rate of decomposition of hydrogen peroxide, catalysed by manganese(IV) oxide.

2H2O2 (aq) → 2H2O (l) + O2 (g)

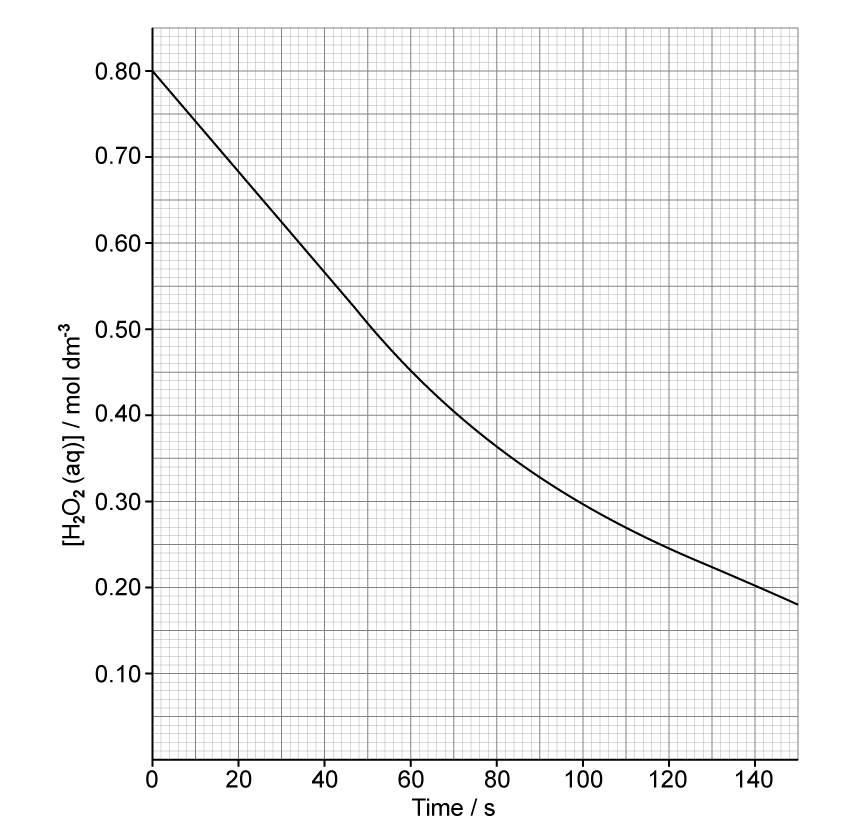
The student monitored the concentration of hydrogen peroxide over time. The results are shown on the graph in Figure 1.

Figure 1

Graph showing the concentration of hydrogen peroxide in mol dm⁻³ decreasing over time in seconds, with a smooth curve from 0.80 to 0.10.

Draw a tangent to the curve at time t = 40 s on Figure 1.

Use your tangent to calculate the rate of reaction at this time.

State the units for the rate of reaction.

9b2 marks

Explain why the rate of reaction decreases as the reaction proceeds.

9c2 marks

Use the graph to show that the reaction is first order with respect to H2O2.
Show your working on the graph.

9d2 marks

Use the half-life of the reaction to calculate the value of the rate constant, k. Include units for k.

10a2 marks

A student investigated the effect of temperature on the rate constant, k, for the decomposition of an organic compound. The results are shown in Table 1.

Table 1

Temperature, T / K

Rate constant, k / s-1

1/T / K-1

ln(k)

620

1.22 × 10⁻⁴

1.61 × 10⁻³

–9.01

640

2.51 × 10⁻⁴

1.56 × 10⁻³

660

5.05 × 10⁻⁴

1.52 × 10⁻³

–7.59

680

9.88 × 10⁻⁴

–6.92

700

1.85 × 10⁻³

1.43 × 10⁻³

–6.29

Complete Table 1.

10b3 marks

The Arrhenius equation can be expressed in the form ln(k) = –Ea/RT + ln(A).

Plot a graph of ln(k) on the y-axis against 1/T on the x-axis.

White grid paper with light grey lines forming small squares, evenly distributed across the entire sheet, used for drawing or mathematical calculations.

Draw a line of best fit.

10c3 marks

Use your graph to determine the gradient of the line of best fit.

Use the gradient to calculate the activation energy, Ea, for this reaction.

Give your answer in kJ mol-1, to three significant figures.

The gas constant R = 8.31 J K-1 mol-1.