Energy & Photosynthesis (College Board AP® Biology): Exam Questions

1 hour29 questions
1a1 mark

Photosynthesis is the process by which autotrophic organisms, such as plants, convert light energy into chemical energy. This process takes place in the chloroplasts and consists of two main stages: the light-dependent reactions and the Calvin cycle.

Identify the organelle where photosynthesis occurs.

1b1 mark

Describe the role of light energy in the light-dependent reactions of photosynthesis.

1c1 mark

Explain how the Calvin cycle depends on the products of the light-dependent reactions.

1d1 mark

There are 3 different types of chlorophyll that absorb a range of different wavelengths of light, as shown in the absorption spectrum in Figure 1. Green light has a wavelength of between 500 and 570nm.

Graph showing light absorption peaks of chlorophyll a, chlorophyll b, and carotenoids across wavelengths 400-700 nm; key differentiates each line style.
Figure 1. Graph to show the absorption of light of different wavelengths by chlorophyll
Graph of light absorption by chlorophyll a, chlorophyll b, and carotenoids across wavelengths 400-700 nm with key for line types.

Predict what would happen to photosynthesis if a plant were exposed to only green light.

Did this page help you?

2a1 mark

Photosynthesis is the process by which autotrophic organisms convert light energy into chemical energy. This process occurs in two stages: the light-dependent reactions, which occur in the thylakoid membranes, and the Calvin cycle, which occurs in the stroma.

Plants use pigments like chlorophyll a and b to absorb light energy. Different wavelengths of light impact the rate of photosynthesis differently.

Describe the role of the primary pigment in photosynthesis.

2b1 mark

Pigments are arranged in structures called photosystems.

Explain the need for two different photosystems.

2c1 mark

Describe how a proton gradient results in the production of ATP from ADP + inorganic phosphate in the electron transport chain of the light-dependent reactions.

2d1 mark

Predict how the proton gradient across the thylakoid membrane would be affected by low light intensity.

Did this page help you?

3a1 mark

The light-dependent reactions of photosynthesis convert light energy into ATP and NADPH, which fuel the Calvin cycle.

Identify the specific location in the chloroplast where the light-dependent reactions occur.

3b1 mark

Describe how energy from sunlight is captured during the light-dependent reactions.

3c1 mark

Explain the role of carbon dioxide in the production of organic molecules in the Calvin cycle.

3d1 mark

Explain the effect of low light intensity on the Calvin cycle.

Did this page help you?

4a1 mark

Photosynthesis is the process by which plants convert light energy into chemical energy to produce glucose. This process occurs in the chloroplast and consists of two main stages:

  1. The light-dependent reactions

  2. The Calvin cycle

Identify the gas taken in by plants and used in the Calvin cycle.

4b1 mark

Describe the function of ATP in photosynthesis.

4c1 mark

Justify the need for light-dependent reactions to occur prior to the Calvin cycle in photosynthesis.

4d1 mark

A scientist predicts that plants exposed to a higher light intensity require a greater quantity of ADP. Justify this prediction.

Did this page help you?

5a1 mark

The light-dependent reactions of photosynthesis occur in the thylakoid membranes of the chloroplast.

Identify the two products produced in the light-dependent reactions that are required for the Calvin cycle.

5b1 mark

Describe how the structural features of a chloroplast enable it to maximise the efficiency of the light-dependent reactions.

5c1 mark

Energy is required to drive photosynthesis.

Describe the result of a sustained loss in energy flow or molecular order in a living system.

5d1 mark

Explain how energy is released from ATP to power cellular processes.

Did this page help you?

1a3 marks
qp2-2013-frq-ap-biology

Color

Wavelength (nm)  

Violet 

380–450

Blue

450–475 

Cyan

475–495 

Green 

495–570 

Yellow

570–590

Orange 

590–620

Red 

620–750

An absorption spectrum indicates the relative amount of light absorbed across a range of wavelengths. The graphs above represent the absorption spectra of individual pigments isolated from two different organisms. One of the pigments is chlorophyll a, commonly found in green plants. The other pigment is bacteriorhodopsin, commonly found in purple photosynthetic bacteria. The table above shows the approximate ranges of wavelengths of different colors in the visible light spectrum.

Identify the pigment (chlorophyll a or bacteriorhodopsin) used to generate the absorption spectrum in each of the graphs above. Explain and justify your answer.

1b5 marks

In an experiment, identical organisms containing the pigment from Graph II as the predominant light-capturing pigment are separated into three groups. The organisms in each group are illuminated with light of a single wavelength (650 nm for the first group, 550 nm for the second group, and 430 nm for the third group). The three light sources are of equal intensity, and all organisms are illuminated for equal lengths of time. Predict the relative rate of photosynthesis in each of the three groups. Justify your predictions. 

1c2 marks

Bacteriorhodopsin has been found in aquatic organisms whose ancestors existed before the ancestors of plants evolved in the same environment. Propose a possible evolutionary history of plants that could have resulted in a predominant photosynthetic system that uses only some of the colors of the visible light spectrum.

Did this page help you?

2a3 marks

Matter continuously cycles through an ecosystem. A simplified carbon cycle is depicted below.

qp4-2013-frq-ap-biology

Identify the key metabolic process for step I and the key metabolic process for step II, and briefly explain how each process promotes movement of carbon through the cycle. For each process, your explanation should focus on the role of energy in the movement of carbon. 

2b1 mark

Identify an organism that carries out both processes.

Did this page help you?

3a1 mark

Noncyclic electron flow and cyclic electron flow are two major pathways of the light-dependent reactions of photosynthesis. In noncyclic electron flow, electrons pass through photosystem II, then components of a chloroplast electron transport chain, and then photosystem I before finally reducing NADP+ to NADPH. In cyclic electron flow, electrons cycle through photosystem I and some components of the electron transport chain (Figure 1).

qp4-2023-frq-ap-biology

Figure 1. The pathways of noncyclic and cyclic (heavy arrows) electron flow. The cytochrome complex is a component of the electron transport chain between the two photosystems.

Describe the role of chlorophyll in the photosystems of plant cells.

3b1 mark

Based on Figure 1, explain why an increase in the ratio of NADPH to NADP+ will cause an increase in the flow of electrons through the cyclic pathway.

3c1 mark

Using rice plants, scientists examined the effect of a mutation that results in the loss of the protein CRR6.
CRR6 is a part of the photosystem I complex, and its absence reduces the activity of photosystem I.

Predict the effect of the mutation on the rate of biomass (dry weight) accumulation.

3d1 mark

Justify your prediction in part (c).

Did this page help you?

4a1 mark

The light-dependent reactions of photosynthesis take place in the thylakoid membranes of the chloroplast. These reactions convert light energy into ATP and NADPH, which power the Calvin cycle in the stroma.

Figure 1. below represents a simplified model of the electron transport chain in the thylakoid membrane, showing the movement of electrons and protons during ATP and NADPH formation.

Diagram of the thylakoid membrane showing photosystems II and I, electron transfer, production of NADPH and ATP via ATP synthase, driven by light.
Figure 1. The light dependent reactions of photosynthesis

Describe the role of Photosystem II (PSII) in initiating the electron transport chain.

4b1 mark

Explain how the proton gradient generates ATP in the light-dependent reactions.

4c1 mark

Researchers applied a chemical called FCCP to isolated chloroplasts. FCCP acts as a protonophore, allowing protons (H⁺) to diffuse freely across the thylakoid membrane, bypassing ATP synthase.

Predict the effect that FCCP would have on ATP production in the chloroplast.

4d1 mark

Justify your prediction frm part (c).

Did this page help you?

1a1 mark

Photosynthesis is influenced by various factors, including light intensity, temperature, and carbon dioxide (CO₂) availability. Scientists conducted an experiment to measure the rate of photosynthesis in an aquatic plant by measuring the oxygen production at different CO₂ concentrations. The results are shown in Table 1.

Table 1: Effect of CO₂ concentration on the rate of photosynthesis

CO₂ concentration (ppm)

Oxygen production (mL O₂/hr)

100

1.2 ± 0.1

200

2.4 ± 0.2

300

4.0 ± 0.3

400

5.1 ± 0.2

500

5.4 ± 0.2

600

5.5 ± 0.1

(i) Describe the trend in the data regarding the effect of CO₂ concentration on oxygen production.

(ii) Explain the change in oxygen production.

1b5 marks

(i) Construct a labeled graph representing the data in Table 1.

A blank grid with fine grey lines forming squares, ideal for technical drawings or graphs, on a white background.

(ii) Calculate the percent change in oxygen production from 100 ppm to 400 ppm CO₂ concentration.

1c1 mark

RuBisCO is an enzyme responsible for carbon fixation during the Calvin cycle. Scientists hypothesized that RuBisCO was responsible for the data trend seen after CO2 levels exceeded 400 ppm.

Based on the data, explain how RuBisCO could be responsible for this trend.

1d2 marks

To further explore regulatory factors, a second trial was conducted using the same experimental conditions, but with the addition of a synthetic competitive inhibitor called Photorate-1. This molecule competes with CO₂ at the active site of RuBisCO.

(i) Predict what effect Photorate-1 will have on the production of oxygen during photosynthesis.

(ii) Justify your prediction.

Did this page help you?

2a2 marks

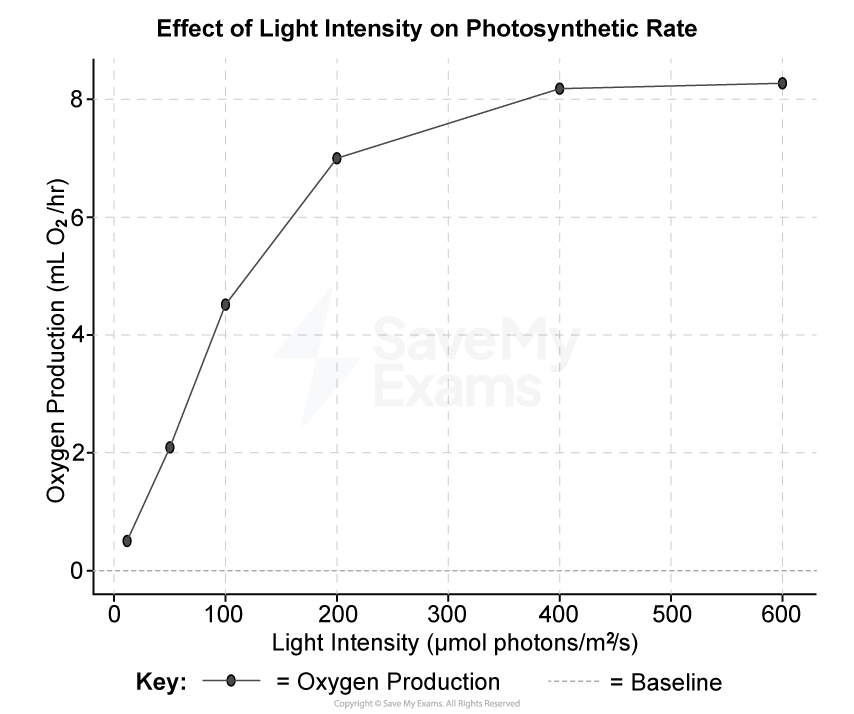
Photosynthesis is a process driven by light energy, but its rate is affected by multiple environmental factors. Scientists aimed to investigate how light intensity influences photosynthetic rates in an aquatic plant, Elodea canadensis. This plant releases oxygen bubbles as a byproduct of photosynthesis, which can be measured to determine the rate of photosynthesis.

The researchers placed identical samples of Elodea in beakers containing distilled water and a sodium bicarbonate (NaHCO₃) solution to provide a constant source of CO₂. Each beaker was exposed to a different light intensity (µmol photons/m²/s) using an adjustable lamp. The number of oxygen bubbles produced per minute was recorded as an indirect measure of the photosynthetic rate. The data is shown in Figure 1.

Graph showing the effect of light intensity on photosynthetic rate. Oxygen production increases with light intensity up to 300 μmol/m²/s, then plateaus.
Figure 1. The effect of light intensity on oxygen production in aquatic plants.

(i) Describe the role of light energy in the light-dependent reactions.

(ii) Explain why increasing light intensity affects the rate of photosynthesis.

2b3 marks

(i) State an appropriate hypothesis for the experiment detailed in part (a).

(ii) Identify one control variable that should be kept constant.

(iii) Explain why this control variable should be kept constant.

2c2 marks

There are two types of chlorophyll in chloroplasts, chlorophyll a and chlorophyll b. Researchers created a genetically modified (GM) vine plant with an allele that caused them to synthesise higher levels of chlorophyll b than wild-type vine plants. They investigated the effect of this new allele on the rate of plant growth.

The researchers grew wild-type and GM vines. They grew some of each in low light intensity and grew others in high light intensity. They extracted chloroplasts from mature plants of both types. Finally, they measured oxygen production at different light intensities by the chloroplasts they had extracted from the plants.

screenshot-2022-07-25-14-12-45

(i) Oxygen production here is used as a measure of the rate of photosynthesis. Describe why this is possible.

(ii) Calculate the percent increase in oxygen production caused by the genetic modification for vines grown at high light intensity at an experimental light intensity of 20 mmol photons m-2 min-1. Give your answer to 3 significant figures.

2d1 mark

The researchers suggested that GM plants producing more chlorophyll b would grow faster than wild-type plants in all light intensities.

Explain how the data in part c) supports this suggestion.

Did this page help you?

3a2 marks

The primary enzyme responsible for carbon fixation in the Calvin cycle is RuBisCO (ribulose-1,5-bisphosphate carboxylase/oxygenase). As an enzyme, its efficiency is affected by temperature, however, RuBisCO also exhibits a temperature sensitive dual affinity for CO₂ and O₂. At high temperatures, RuBisCO favors binding to O₂ instead of CO₂.

Researchers measured carbon fixation rates (CO₂ uptake in μmol/m²/s) in Elodea canadensis, an aquatic plant, at different temperatures. The experiment was repeated in two CO₂ conditions:

  1. Ambient CO₂ (~400 ppm, normal air levels)

  2. Elevated CO₂ (~800 ppm, enriched conditions)

The results are presented in Table 1.

Table 1: Effect of temperature on carbon fixation rate at two CO₂ concentrations

Temperature (°C)

Carbon fixation rate (μmol CO₂/m²/s) at 400 ppm CO₂ (± SE)

Carbon fixation rate (μmol CO₂/m²/s) at 800 ppm CO₂ (± SE)

15

10.5 ± 0.6

12.1 ± 0.5

20

15.3 ± 0.8

18.6 ± 0.6

25

18.9 ± 0.7

22.4 ± 0.8

30

14.8 ± 1.0

18.1 ± 0.9

35

9.5 ± 1.2

13.0 ± 1.1

40

5.2 ± 1.4

7.6 ± 1.3

(i) Using the information given and your knowledge of the Calvin cycle, describe the role of RuBisCO in the production of glucose

(ii) Explain why temperature influences the efficiency of RuBisCO in the Calvin cycle.

3b4 marks

Construct an appropriate graph representing the data in Table 1.

Grid paper with fine, grey lines forming small squares across the entire surface, commonly used for technical drawings or mathematical work.
3c2 marks

(i) Describe the trend in the data from your graph shown in part (b).

(ii) The optimum temperature for RuBisCo is 30 °C, explain the trend in carbon fixation rate observed at temperatures above 25°C.

3d1 mark

Rising atmospheric carbon dioxide (CO₂) levels trap heat and drive global warming, but scientists hypothesize that carbon fixation may remain stable under these changing climate conditions.

Use evidence from the data and your knowledge to justify this claim.

Did this page help you?