Energy Resources (Cambridge (CIE) AS Environmental Management): Exam Questions

Exam code: 8291

53 mins6 questions
1a6 marks

(i) Countries need long-term and short-term energy security.

Define:

long-term energy security ................................................................................................

short-term energy security ................................................................................................

[2]

(ii) Energy insecurity impacts low-income economy countries (LICs).

Outline four of these impacts.

[4]

1b6 marks

Fig. 3.1 shows the location of hydroelectric projects in country Y and country Z.

A new dam is planned in country X to meet the increasing energy demands of the country. Country X is a low-income economy country (LIC). Currently, only 22% of the population of country X has access to electricity.
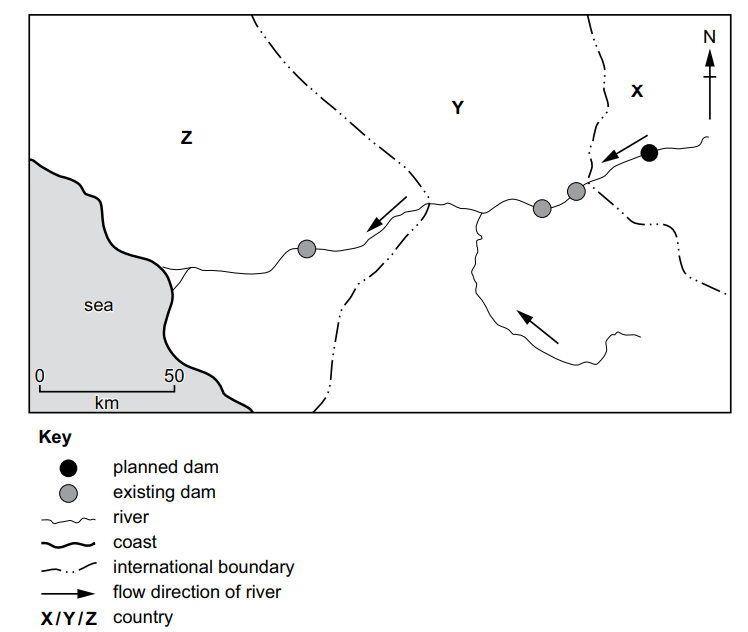
Map showing countries X, Y, Z with rivers flowing to the sea. Symbols indicate one planned and three existing dams, with international boundaries marked.

Fig. 3.1

Explain the impacts the new dam could have on the economies of countries X, Y and Z.

Include positive and negative impacts in your answer.

28 marks

Fig. 5.2 shows data for the percentage of the total energy generated from fossil fuels for HICs and LICs between 1960* and 2015.

Line graph showing fossil fuel energy percentage from 1960 to 2015, comparing high-income (steady) and low-income countries (decline post-2000).

Fig. 5.2

Fig. 5.3 shows data for the percentage of the total energy generated from renewable energy resources for HICs and LICs between 1990 and 2015.

Graph showing the percentage of energy from renewables for HICs and LICs from 1990 to 2015. HICs rise steadily, LICs remain low. Key included.

Fig. 5.3

Explain the trends in the percentage of the total energy generated from fossil fuels and renewable energy resources in HICs and LICs.

Use data from Figs. 5.1, 5.2 and 5.3 to support your answer

3a2 marks

Oil sands contain deposits of oil.

Fig. 1.1 is an enlarged sketch of an oil sands sample. Each grain of sand is surrounded by a layer of water and a type of oil called bitumen.

Diagram showing bitumen, sand, and water composition in a circular section. Includes a key with textures for each material and a 1 mm scale bar.

Fig. 1.1

Oil is a fossil fuel.

State two other fossil fuels.

3b3 marks

Fig. 1.2 shows the location of oil sands deposits in Canada. These are some of the largest deposits of oil on Earth.

Map highlighting oil sands deposits in Alberta, Canada with key. Calgary and Edmonton are marked. North America outlined with major river paths shown.

Fig. 1.2

Use Fig. 1.2 to suggest the challenges of exporting oil from these oil sands locations.

Give reasons for your answer.

3c3 marks

A pipeline for transporting oil was planned to run from Canada to the USA. Many people objected to the building of this pipeline.

Suggest reasons why some people were in favour of building this pipeline.

4a1 mark

Fig. 3.1 shows the contribution of different sources of energy to the total amount of electricity generated in three countries.

Three pie charts comparing energy sources in Costa Rica, Iceland, and Brazil. Key: hydroelectric, wind, geothermal, biomass and solar, non-renewable.

State the largest source of renewable energy used by the three countries shown in Fig. 3.1.

4b1 mark

State one other source of renewable energy other than those shown in Fig. 3.1.

4c2 marks

Climate change can result in drought. Explain how droughts can lead to energy insecurity in Brazil.

4d2 marks

Suggest why Costa Rica might be described as being more energy secure than Iceland.

5a7 marks

In 2020, 83% of homes in the United Kingdom combusted natural gas (methane) for heating.

In January 2020, a blend of 20% hydrogen gas and 80% natural gas was trialled in 100 homes. The trial cost more than $9 million.

When hydrogen is combusted, it generates heat and water.

It is estimated that switching to 100% hydrogen gas will save 6 million tonnes of carbon dioxide per year from being emitted into the atmosphere.

(i) Explain why alternative fuels to methane are needed.

[3]

(ii) Suggest two reasons why the trial to replace methane might not be extended to the whole of the United Kingdom.

[2]

(iii) Hydrogen can be obtained from methane. This process emits carbon dioxide.
State two strategies for removing carbon dioxide once it is in the atmosphere.

[2]

5b6 marks

Fig. 1.1 shows fossil fuel consumption as a percentage of total energy consumption for high-income economy countries (HICs) and low-income economy countries (LICs) between 1970 and 2015.

Line graph showing energy consumption of HICs and LICs from 1970 to 2015; HICs decline, LICs rise slightly then fall after 2005.

(i) Compare the trends shown in fossil fuel consumption for HICs and LICs shown in Fig. 1.1.

[4]

(ii) Some countries do not have a supply of fossil fuels. They have to import fossil fuels into their country.

Explain how this can lead to energy insecurity.

[2]

66 marks

A report stated that 3 billion people cook their food using stoves that require open fires.

Wood is a common fuel for the open fire used in these stoves. It takes a family around 20 hours per week to gather enough wood for the stove.

An unventilated open fire produces the same amount of air pollution in one hour as the smoke from 400 cigarettes. Smoke contains particulates.

Fig. 5.1 shows an unventilated wood burning stove.

Fig. 5.2 shows a stove powered by solar energy. Sunlight is reflected onto a metal pot from a panel with a shiny surface.

Diagram showing two cooking methods: Fig. 5.1 depicts a wood-fuelled stove, and Fig. 5.2 illustrates a solar cooker with a tripod, metal pot, and reflective panel.

Suggest the advantages and disadvantages of using a stove powered by solar energy compared with using an unventilated wood burning stove.