How do we measure development? (WJEC Eduqas GCSE Geography B): Revision Note
Exam code: C112

Specification links
The notes on this page cover part 1.3.1 of the WJEC Eduqas B specification
1.3.1 - What are global patterns of development?
How development data and images are used to learn about levels of development in different countries, including the UK.
The limitations of using data to ascertain levels of development.
The merits of using economic data alongside human/social development data.
How we define groups of countries that have similar characteristics.
Definitions must include ‘Least Economically Developed Countries’ or 'Low Income Countries' (LICs) and ‘Newly Industrialised Countries’ (NICs).
What is development?
Development is the improvement in people's standard of living
This improvement may be:
Economic - growth of the economy due to changes in economic activities and technology
Social - improvement in people's health, education, water and food supply
Environmental – more sustainable use of the environment
Development is not a smooth, continuous process
A range of factors may slow, halt, and even reverse development, including:
War/conflict
Disease
Disasters
Economic recession
Development can occur through:
Investment in agriculture (tractors, fertilisers, etc.) improves food supplies, which in turn, improves the health of people
Improvements in supplies of power to rural areas
Improvements in access to education for females and overall literacy rates
How is development measured?
Development is hard to measure accurately, as it covers so many features or strands
It is measured using indicators
Social indicators include:
Quality of life and social well-being
Equal opportunities, access to services such as education and healthcare
Life expectancy, birth control, education
Diversity, traditions and heritage
Economic indicators include:
Employment, income and general wealth
Savings, house building, house sales, consumer spending, international trade
Resources, pollution controls and conservation
Individual indicators are misleading when used alone, as some features develop before others
This may indicate that a country is more developed than it really is
By using multiple indicators as a measure of development, a clearer picture of that country's development is produced
A country's GDP (gross domestic product), GNI (gross national income), and GNP (gross national product) are the traditional measures used to measure wealth
Measures of development
Economic sectors
Economic sectors are indicators of a country's economic development, using either:
The amount each sector contributes to the Gross Domestic Product (GDP)
The percentage of the population they employ
The proportions of each economic sector's GDP and employment change over time:
In the pre-industrial period, the primary sector dominated with steady increases in the secondary and tertiary sectors
As countries develop, the reliance on the primary sector for GDP and employment rapidly decreases
During the industrial period, the amount of GDP and employment in the secondary sector increases to become dominant and then decreases
The primary sector continues to decrease, and the tertiary sector increases
Developed countries such as the UK, Germany and France began to move out of this stage in the 1960s
Newly industrialised (emerging) nations such as China and India began to move into this stage at that time
In the post-industrial phase, the tertiary and quaternary sectors increase whilst the secondary and primary sectors decrease
The tertiary sector dominates employment and GDP in the post-industrial period

Causes of change over time
There are several reasons for the change in percentages employed in each sector:
Increasing mechanisation in agriculture led to a decrease in the number of jobs available
People move to urban areas to find jobs in the secondary and tertiary sectors
Increasing mechanisation and global changes then lead to a decrease in secondary employment in some countries - this is known as deindustrialisation
Technological improvements lead to an increase in tertiary and quaternary employment
Examiner Tips and Tricks
You should be able to identify a country's stage of development by examining a pie chart or graph of the economic sectors. A developing country will be dominated by primary economic activities, an emerging country is likely to have fairly equal amounts of each type of economic sector employment, and finally, a developed country will be dominated by tertiary economic activities.
Gross domestic product (GDP)
Gross Domestic Product (GDP) per capita is the total value of goods and services produced within a country in a year, divided by the population of the country
It is a measure of economic wealth
A high GDP improves development
High effect on development
Gross national income (GNI)
Gross national income (GNI) is the total income earned by a country's people and businesses, even if it was earned outside the country
It is a measure of national economic wealth that can be used as an alternative to GDP
GNI increases development
Human development index (HDI)
This uses life expectancy, literacy rate, education level and GNI to calculate a country's score between 0 (least developed) and 1 (most developed)
The UN created the Human Development Index (HDI) in 1990 as a better way of measuring disparities between countries
The higher the HDI, the higher the level of development and quality of life
Norway has the highest HDI at 0.957 (2024)
Niger has the lowest HDI at 0.394 (2024)
Literacy rate
This measures the percentage of adults who can read and write
It is a social (education) indicator
The lower the rate, the lower the development of the country
Life expectancy
The average number of years a person can expect to live
It is a social-health indicator
The lower the age, the lower the development
People per doctor
This measures the average number of people that could be seen by a doctor at any one time
This is a social (health) and education indicator
The lower the number of doctors, the lower the level of health care, and there is also a lack of suitable education to train people
Birth rate
This is the number of live births per 1,000 of the total population in one year
This is a social (women's rights) indicator
A lower birth rate indicates higher levels of development, as women usually have access to better health care
Infant mortality rate
This is the number of children who do not survive to their first birthday per 1,000 babies born
This is a social (health) indicator
The higher the number, the lower the development
Over 18 countries have an infant mortality rate of over 50 per 1000
These are all developing countries
Most of these countries are in Sub-Saharan Africa
Death rate
This is the number of deaths per 1,000 of the country's population in a year
This is a social (health) indicator
The lower the number, the higher the development
Lack of healthcare, nutrition, clean water, and sanitation raises death rates in developing countries
Access to safe water
This is the percentage of people who have access to safe drinking water
This is a social (health) indicator
The higher the rate, the higher the level of development
How effective are development indicators?
Gross domestic product (GDP)
GDP ignores the welfare component, as the goods and services produced may or may not add to the welfare of society
Pollution or even happiness leaves out some production in an economy, such as homegrown food
Gross national income (GNI)
The measure only takes into account one factor – income
It is an average calculation, so a few wealthy people can distort the figures
Data about income is sensitive, so people may not always be honest about their earnings
People working in the informal sector and 'stay-at-home' parents are not taken into account
GNI per head is an average and hides information about whether a person is either rich or poor, or the quality of life within the country
Human development index (HDI)
The index only takes into account four indicators of development, and the statistics provided by some countries may be unreliable and subjective
The HDI is a general measure that relies on average calculations
It does not take into account disparities (differences) that might exist within a country
Literacy rate
This can be hard to measure in LICs due to a lack of monitoring
Conflict zones and squatter settlements are difficult areas to measure literacy rates
Life expectancy
Data is not always reliable, especially in LICs
It can be misleading in countries with a very high rate of infant mortality, as people who survive infancy may live longer than expected
People per doctor
More people are seeking medical help and advice via mobile phone/web chat – this is not included in the data
Birth rate
Some countries may have low birth rates but are quite poor (e.g. Cuba at 10 per 1000 – this is due to political decisions to invest more money in healthcare over other sectors)
Birth control policies can distort this as a measure of overall development (e.g., China, 12 per 1000)
Infant mortality rate
Not all the deaths of children are reported, especially in LICs and remote regions of NICs, meaning the true rates may be even higher
Death rate
By comparison, the death rate is a less reliable measure of development than the birth rate
Birth rates can be high in some LICs due to poverty, but also high in HICs, where many people die of old age
Access to safe water
Data collection in LICs is not likely to be accurate, and official figures can underestimate the issue
People may technically have access, but high costs force people to use unsafe water
Leaking pipes and natural disasters may deprive people of piped water
Comparing countries using development indicators
Levels of development vary on a local, national and international scale
There are differences between areas of the same city, the same country and between countries
Germany is more developed than Mexico, but Egypt is less developed than Mexico
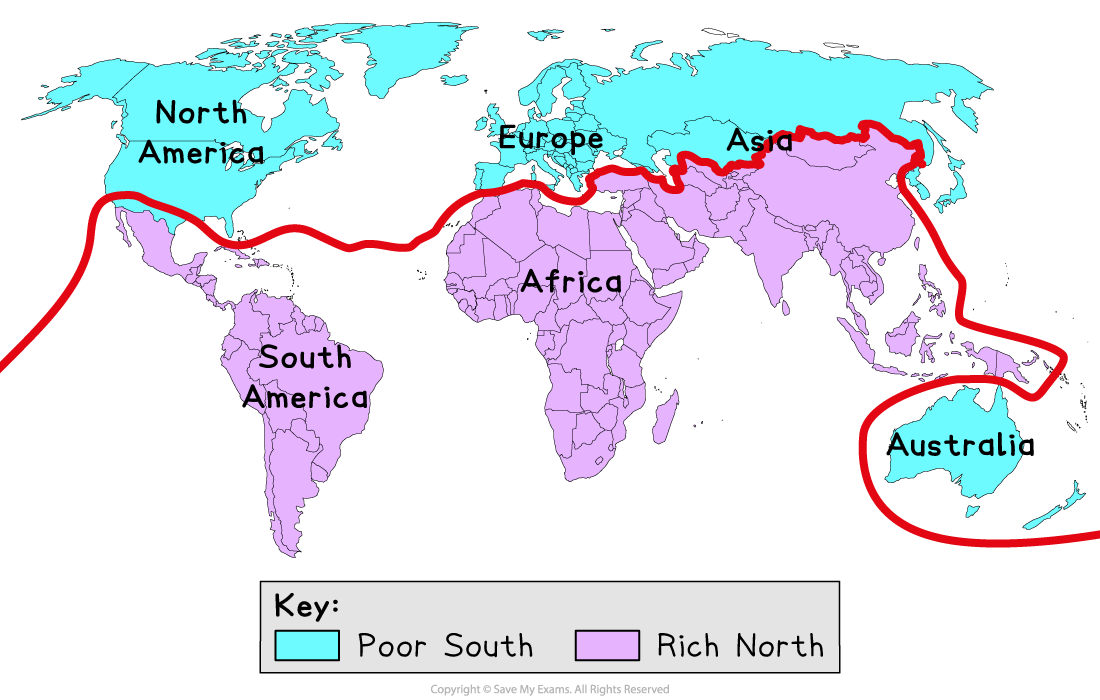
In 1980, the Brandt Report divided the world into the global south and north
It was a theoretical division of the world to visualise inequalities at the time
The line was based on wealth, with countries north of the line generally considered rich and those south considered poor
However, the division oversimplifies global economics and doesn't account for regional differences
Since then, global development has become complex, with countries such as Brazil, India and China developing rapidly
Globally, a country's level of development now follows a sliding-scale continuum from least to most developed
The least economically developed countries (LEDCs) or low-income countries (LICs):
Most people have a poor quality of life with inadequate services and few opportunities
GNI per capita of $1,045 or less, e.g. Chad and Ethiopia
High birth rates, high death rates, high infant and maternal mortality, and a young population structure with short life expectancy
Newly industrialised countries (NICs):
Countries experiencing rapid economic growth and development based on industrial development
Incomes are rising and most people enjoy a reasonable standard of living
GNI per capita of more than $1,045 but less than $12,695, e.g. Mexico, India and Malaysia
Decreasing birth and death rates, declining infant and maternal mortality, and a balanced population structure with a growing adult workforce
High-income countries (HICs):
Countries that have modern industries and where people enjoy a good standard of living with relatively high levels of income
GNI per capita of above $12,696, e.g. Germany and the USA
Low birth and death rates, low infant and maternal mortality, and an ageing population structure with long life expectancy
The differences between low and high development is known as the development gap

Unlock more, it's free!
Join the 100,000+ Students that ❤️ Save My Exams
the (exam) results speak for themselves:

Was this revision note helpful?
